Wednesday Dec 13 2023 05:52

15 min

In trading, asset prices, whether for forex pairs, stocks, or cryptocurrencies*, can be drawn up using various chart formats such as line charts, bar charts, and candlestick charts.
In particular, candlestick charts and candlestick patterns provide a useful way of analysing price movements.
Many traders prefer candlestick charts as candlestick patterns can forecast trend changes or extensions with reasonable precision.

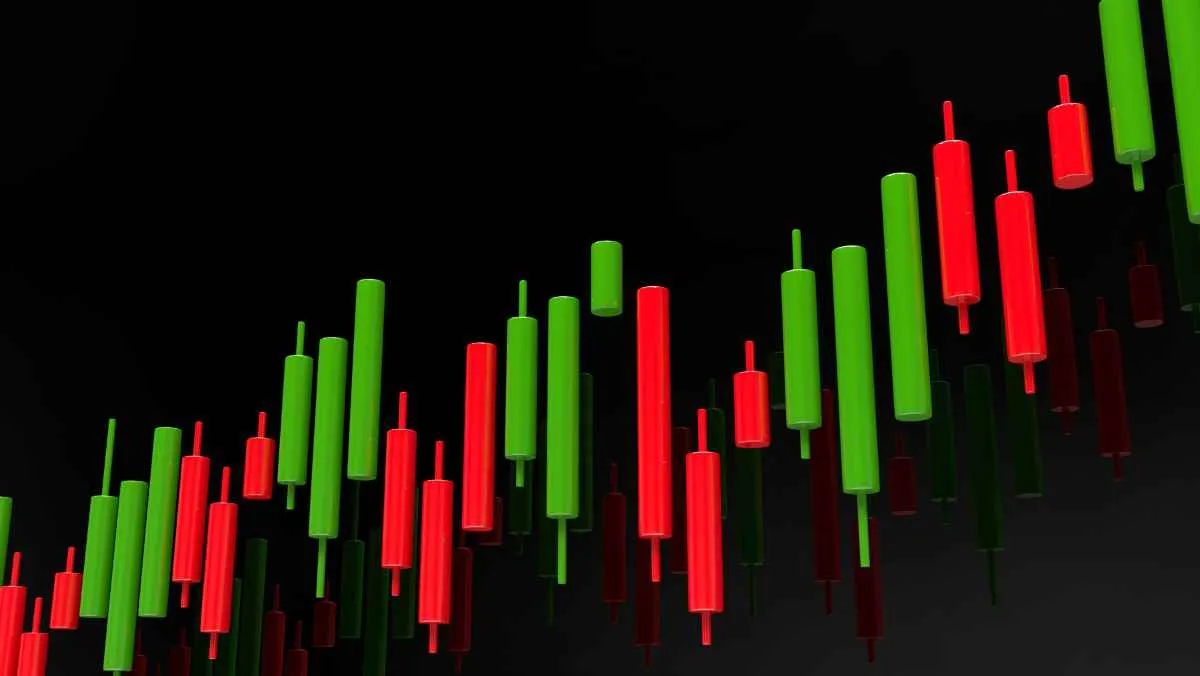
Candlestick patterns are visual representations of how an asset's price has moved on a candlestick chart. It helps traders analyse and predict market behaviour.
Traders noticed that certain price movements tend to follow specific candlestick patterns on the chart, so they categorised these patterns for technical analysis.
But what exactly is a candlestick?
A candlestick chart indicates how the price of an asset has changed in the past.
Each candlestick represents a specific period, which can vary based on the time frame you choose. For instance, if you use a 1D chart, each candlestick represents one day.
It's widely accepted that the concept of candlesticks was invented by Japanese rice trader Munehisa Homma, who wrote The Candlestick Trading Bible.
The Western world began to adopt and use candlestick charting techniques more extensively after Steve Nison published his book Japanese Candlestick Charting Techniques in 1991.

Let’s take a look at the key elements of candlestick charts.
The candle's body signifies the opening and closing prices of an asset.
Where these points are located depends on whether the candlestick and consequently the price, is showing bullish or bearish behaviour during a specific period.
In a bullish market, the closing price is higher than the opening price, while the opposite is true in a bearish market.
Think of the body of the candlestick as the price tag of something you bought. If the price tag is higher than where you bought it (open), you're happy, so it's a bullish market. If it's lower than where you bought it, you're not so happy, hence it's a bearish market.
Most candlesticks have two parts called shadows or wicks, although this can vary. These shadows show the highest and lowest prices during a specific time.
The upper shadow indicates the highest price, while the lower shadow indicates the lowest price.
Sometimes, you might see only one shadow if the other shadow is at the same level as the opening or closing price.
Candle colour
The candle's colour tells you which way the price is moving. Green or white means the price is going up, while red or black means it's going down.
Most trading platforms use these colours. If the body is green, its upper limit denotes the closing price.

A candlestick chart is a detailed pictorial representation of an asset's price. Unlike a simple line chart that only shows the closing price, candlestick charts offer a wealth of historical price information based on their structures.
Candlesticks appear one after the other in chronological order. They can help you identify the overall trend, support, and resistance levels, even without using technical indicators. Specific candlestick patterns suggest when you should buy or sell.
Cryptocurrency traders adopted candlestick charts from stocks and forex. Candlestick charts are particularly useful for cryptocurrencies, which are volatile and need thorough technical analysis.
With practice, candlestick charts are fairly easy to interpret because they hold plenty of information about historical prices.
In addition to the candlestick patterns we've covered, there are also chart patterns created by multiple candlesticks arranged in specific ways such as double tops, double bottoms, flags, pennants, and more.
Both beginner and experienced traders can interpret candlestick charts by simply looking at overall trends.
These visual cues often offer information to spot candlestick patterns within the candlestick charts and how they form, particularly around the support and resistance levels.
Among the numerous candlestick patterns, we'll highlight the most commonly used ones.
Let's start with bullish patterns, which often occur after a downtrend and usually indicate an upward trend.
In cryptocurrency trading, when these patterns show up, traders typically consider opening long positions.
The hammer candlestick has a short body with a long shadow below it, like an upright hammer. Typically, you see this pattern at the end of a downtrend.
It suggests that buyers have pushed the price up after resisting the selling pressure. Hammers can be either green or red, but green hammers indicate a stronger uptrend than red ones.
The inverted hammer looks like the regular hammer pattern but with a much longer upper shadow and a very short lower shadow.
It implies that buyers initially pushed the price up. After trying to pull it down, they failed. This leads to stronger buying pressure, driving prices higher.
Unlike the earlier candlestick patterns, the bullish engulfing pattern involves two candles. The first candle is a small red one, which is completely covered by a larger green candle.
Even though the second candle starts with a lower opening than the first red one, increased buying pressure results in a reversal of the downtrend.
Another two-candlestick pattern to watch for is the piercing line. This can appear either at the end of a downtrend when it hits a support level or during a pullback, suggesting a potential upward movement.
This candlestick pattern comprises a long red candle followed by a long green one. What's crucial here is that there's a significant gap between the red candle's closing price and the green candle's opening price.
The green candle should also cover at least half of the previous day's red candlestick body. The fact that the green candle closes much higher than its opening indicates strong buying pressure.
The morning star candlestick pattern consists of three candles: a long red one, followed by a red small-bodied one, and then a long green candle. This pattern indicates that the selling pressure from the first period is weakening, and a bullish market is emerging.
The three white soldiers, another three-candlestick pattern, consists of three long green candles in a row, typically with short shadows.
The key requirement is that each of these three green candles must open and close at a higher price than the one before. This pattern is seen as a robust bullish signal and typically appears after a downtrend.
Now, let's explore a group of bearish candlestick patterns that suggest a potential reversal of an uptrend.
These candlestick patterns usually occur around resistance areas and often lead traders to consider closing their long positions or even opening short ones.
The hanging man is formed by a green or red candlestick with a short body and a long lower shadow.
It typically appears at the end of an uptrend and suggests a considerable sell-off is coming. But bulls could temporarily push prices higher, after which they may lose control.
The shooting star is similar to the inverted hammer – but in reverse. It's a red candle with a short body and a long upper shadow.
Usually, such candlestick patterns mean the market opened slightly higher, hit a local high, and then closed just below the opening price. Sometimes, the body of the candle is almost invisible.
Bearish engulfing candlestick patterns are the opposite of bullish engulfing patterns. In this pattern, the first candle has a small green body and is entirely overshadowed by the next long red candle.
It usually appears when an uptrend is at its peak and indicates a potential reversal. The further the second red candle extends downward, the stronger the bearish momentum is likely to be.
The evening star is a three-candlestick pattern. It starts with a short candle between a long green one and a big red one that closes below the middle of the initial green candle.
Typically, this candlestick pattern is seen when an uptrend is near its peak and suggests a possible reversal.
The three black crows pattern consists of three long red candles with short or almost no shadows. Each new candle opens at a similar price to the previous one but closes significantly lower. This is seen as a strong bearish signal.
The dark cloud cover pattern is the opposite of the piercing line. It signals a potential bearish reversal and involves two candles.
First, there's a red candle that opens above the previous green candle's body but closes below its middle point. This pattern indicates that bears are gaining control, leading to lower prices. If the candles have short shadows, it often suggests a robust downtrend.
Apart from bullish and bearish patterns that predict trend changes, there are candlestick patterns that are neutral or indicate that the current trend (whether upward or downward) will continue.
These patterns are doji; spinning top; falling three methods, and rising three methods. Let’s take a look at each of them.
A doji candlestick pattern has a small body with a long shadow. It's often seen as a sign that the current trend will continue, but traders should be cautious because it can also indicate a reversal.
To avoid confusion, it's advisable to wait a few candles after you observe a doji pattern to see the direction of the market more clearly before opening a position.
Similar to the doji candlestick pattern, the spinning top is a candlestick pattern with a short body, and its two shadows are of equal length, with the body in the middle.
This pattern also reflects uncertainty and might imply a period of pause or consolidation following a significant price move – whether up or down.
The falling three methods candlestick pattern is made up of five candles arranged in a specific way, signalling that a downtrend is likely to continue.
It starts with a long red candle, followed by three small green candles in a row, and then ends with another long red candle.
The key point is that the small green candles are entirely overshadowed by the bearish red ones, showing that bulls are not strong enough to reverse the downtrend.
The opposite of the falling three methods, the rising three methods candlestick pattern is typically seen in uptrends. This pattern includes a long green candle, followed by three short red candles, and then another long green candle.
Candlestick patterns: In summary
Understanding candlestick patterns is a valuable skill for any trader. These patterns, whether bullish, bearish, or neutral, offer valuable insights into market sentiment and potential price movements.
By recognising these patterns and their significance, you can make more informed decisions in your trading journey.
Don't wait to put your knowledge to the test. The best way to learn and practise CFD trading using candlestick patterns is by opening a risk-free demo CFD account.
Master the art of candlestick chart analysis and experience the excitement of CFD assets without risking your capital with markets.com.
Ready to join our community? Creating an account is easy.
*Cryptocurrency CFDs are banned in the United Kingdom.
"When considering "CFDs" for trading and price predictions, remember that trading CFDs involves a significant degree of risk and could result in capital loss. Past performance is not indicative of any future results. This information is provided for informative purposes only and should not be construed to be investment advice."
