Friday Mar 8 2024 11:50

11 min

When it comes to Forex trading, mastering the art of technical analysis is crucial for success. One of the most popular and widely used indicators in this field is the Moving Average.
In this article, we will delve into the world of Moving Averages and explore how they can be harnessed to enhance your trading strategies. Whether you are a seasoned trader or just starting out, understanding Moving Averages and their significance is essential.
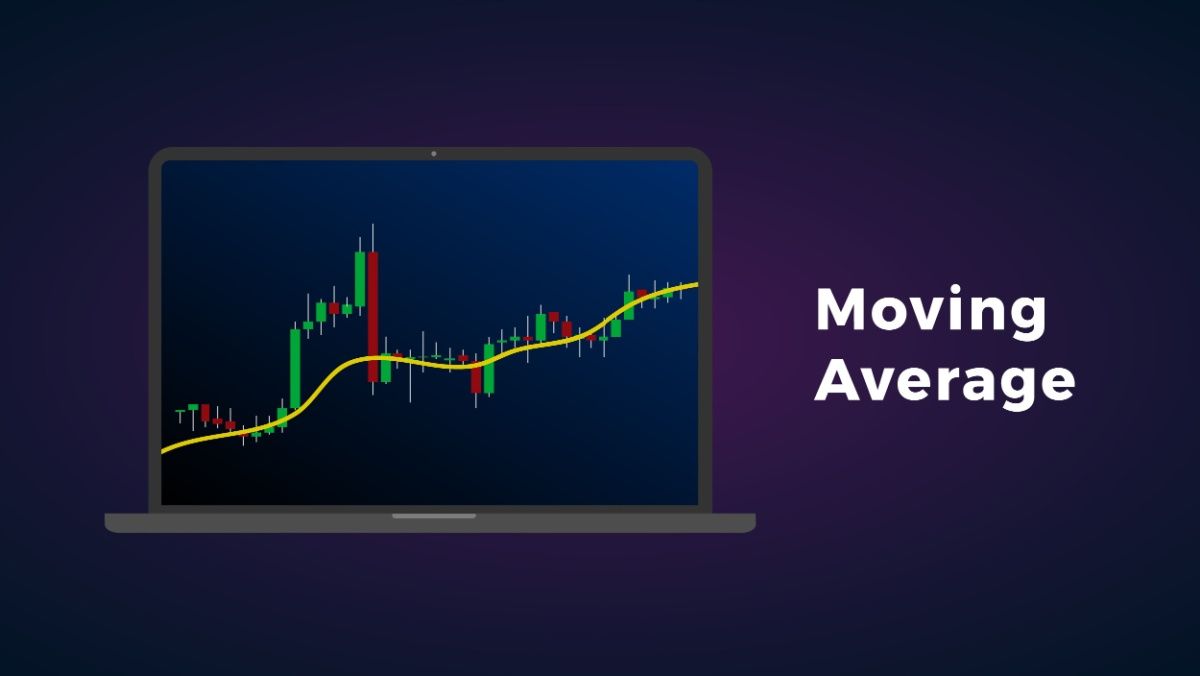
Moving Averages are mathematical calculations that help smooth out price data over a specified period. They are called "moving" because they constantly update as new data becomes available, providing traders with a clearer picture of the price trend.
Moving Averages are widely used as they offer valuable insights into market trends, support and resistance levels, and potential entry and exit points.
Moving Averages can be applied to different timeframes, ranging from short-term charts like the 5-minute or 15-minute to longer-term charts like the daily or weekly. The choice of timeframe depends on the trading strategy and the trader's preference.
Shorter time frames provide more frequent signals but may be more prone to market noise, while longer timeframes offer more reliable signals but with fewer trading opportunities.
There are several types of Moving Averages, but the two most commonly used are the Simple Moving Average (SMA) and the Exponential Moving Average (EMA).
The SMA calculates the average of a specified number of periods by summing up the closing prices and dividing it by the number of periods. The EMA, on the other hand, places more weight on recent data points, making it more responsive to price changes.
While the SMA is easy to calculate, the EMA is favoured by many traders due to its ability to react quickly to market movements.
The choice between the two depends on personal preference and trading style. Some traders prefer the simplicity of the SMA, while others value the responsiveness of the EMA.
Calculating Moving Averages is a relatively simple process. For example, to calculate a 10-day SMA, you would add up the closing prices of the last 10 days and divide it by 10. The result is the SMA value for that day.
As new data becomes available, the oldest data point is dropped, and the newest data point is added, keeping the moving average up to date.
For the EMA, the calculation is more complex as it involves giving more weight to recent data. The formula takes into account the previous EMA value, the current closing price, and a smoothing factor.
The smoothing factor determines the weight given to the current closing price, with higher values placing more emphasis on recent data.

Moving Averages can be used as support and resistance levels in Forex trading. When the price is above a Moving Average, it can act as a support level, indicating that the price is likely to bounce off and continue its upward trend.
Conversely, when the price is below a Moving Average, it can act as a resistance level, suggesting that the price is likely to encounter selling pressure and continue its downward trend.
Traders often look for price bounces off Moving Averages as potential entry or exit points. For example, if the price bounces off a rising 50-day SMA, it could be a bullish signal, indicating a potential buying opportunity.
Similarly, if the price fails to break above a falling 200-day SMA, it could be a bearish signal, suggesting a potential selling opportunity.
One of the most powerful strategies involving Moving Averages is the Moving Average crossover. This strategy involves the intersection of two Moving Averages of different timeframes.
When the shorter-term Moving Average crosses above the longer-term Moving Average, it generates a buy signal. Conversely, when the shorter-term Moving Average crosses below the longer-term Moving Average, it generates a sell signal.
The Moving Average crossover strategy can be used to identify trends and potential entry and exit points. For instance, if the 50-day SMA crosses above the 200-day SMA, it is known as a "golden cross" and is considered a bullish signal.
On the other hand, if the 50-day SMA crosses below the 200-day SMA, it is known as a "death cross" and is considered a bearish signal.
It is important to note that Moving Average crossovers can generate false signals, especially in ranging or choppy markets. Therefore, it is advisable to use other indicators or confirmatory signals to filter out false signals and increase the accuracy of the strategy.
While Moving Average crossovers are a popular strategy, several advanced techniques can further enhance the effectiveness of Moving Averages in Forex trading.
One such technique is the use of multiple Moving Averages of different timeframes. By combining Moving Averages of various lengths, traders can gain a more comprehensive view of the market and filter out noise.
For example, a trader may use a combination of a 50-day SMA, a 100-day SMA, and a 200-day SMA. When all three Moving Averages align in a specific direction, it can provide a stronger confirmation of the trend. This technique is known as the "Moving Average ribbon" and can be a powerful tool for trend identification and trade execution.
Another advanced strategy involves the use of Moving Averages with Fibonacci retracement levels. Fibonacci retracement levels are horizontal lines that indicate potential support or resistance levels based on the Fibonacci sequence.
When a Moving Average aligns with a Fibonacci retracement level, it can provide a high-probability trading opportunity.

Moving Averages can be even more powerful when combined with other technical indicators.
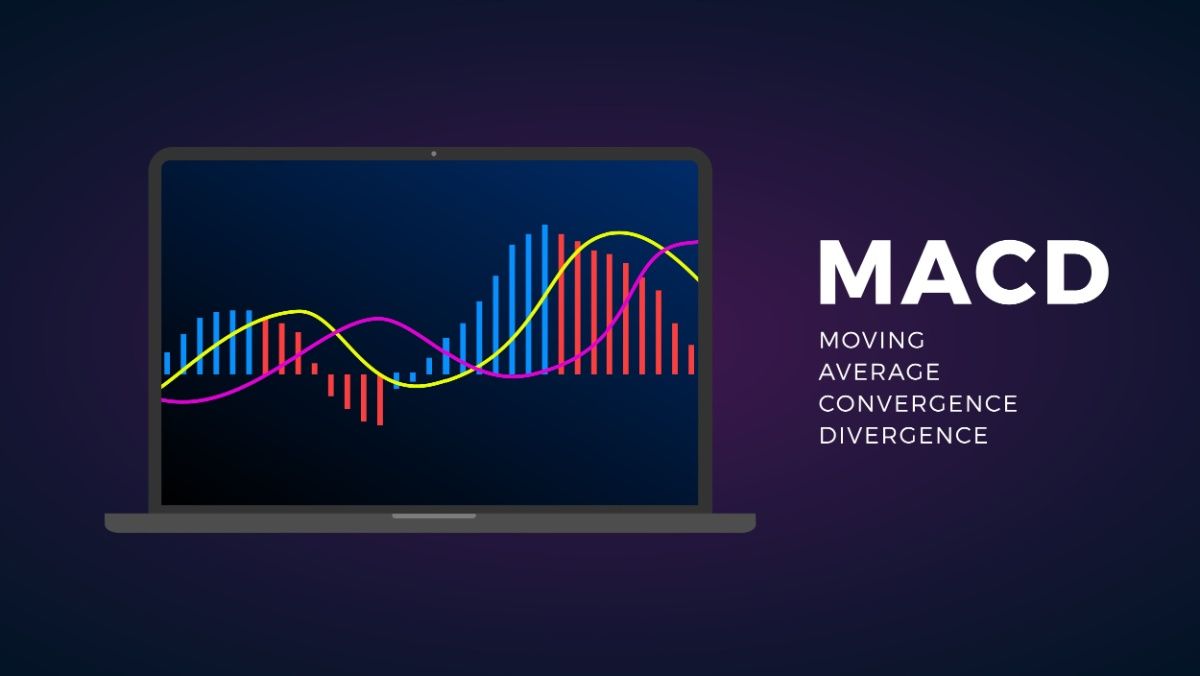
By using Moving Averages in conjunction with indicators such as the Relative Strength Index (RSI), the Moving Average Convergence Divergence (MACD), or the Bollinger Bands, traders can gain deeper insights into market conditions and increase the accuracy of their trading signals.
For instance, the RSI can help identify overbought or oversold conditions in the market, providing valuable information for potential reversals.
When the price is above a Moving Average and the RSI is in overbought territory, it can signal a potential bearish reversal. Conversely, when the price is below a Moving Average and the RSI is in oversold territory, it can signal a potential bullish reversal.
While Moving Averages can be a powerful tool, it is important to avoid common mistakes that can lead to poor trading decisions.
One common mistake is relying solely on Moving Averages without considering other factors such as market fundamentals or geopolitical events. Moving Averages should be used as part of a comprehensive trading strategy that takes into account multiple factors.
Another mistake is using Moving Averages on their own without confirming signals from other indicators or technical analysis tools. It is essential to use Moving Averages in conjunction with other indicators to increase the accuracy of trading signals and avoid false signals.
To illustrate the effectiveness of Moving Averages in Forex trading, let's take a look at a few case studies.
In the first case study, a trader identifies a bullish trend using the Moving Average crossover strategy. The 50-day SMA crosses above the 200-day SMA, generating a buy signal. The trader enters a long position and rides the trend, resulting in a profitable trade.
In the second case study, a trader combines Moving Averages with Fibonacci retracement levels. The price bounces off a 50-day SMA, coinciding with a key Fibonacci retracement level.
The trader enters a long position and sets a stop-loss below the Moving Average and the Fibonacci level. The trade goes in the trader's favour, resulting in a successful trade.
Moving Averages are a versatile and powerful tool in Forex trading. They provide valuable insights into market trends, support and resistance levels, and potential entry and exit points.
By understanding the different types of Moving Averages, calculating them accurately, and using them in conjunction with other technical indicators, traders can enhance their trading strategies and increase their chances of success.
Whether you are a beginner or an experienced trader, mastering Moving Averages is essential for achieving Forex trading success. So, take the time to study and experiment with Moving Averages, and unleash their power in your trading journey.
Learn and trade with markets.com: the ultimate trading community.
“When considering “CFDs” for trading and price predictions, remember that trading CFDs involves a significant risk and could result in capital loss. Past performance is not indicative of any future results. This information is provided for informative purposes only and should not be considered investment advice.”
Risk Warning: this article represents only the author’s views and is for reference only. It does not constitute investment advice or financial guidance, nor does it represent the stance of the Markets.com platform.When considering shares, indices, forex (foreign exchange) and commodities for trading and price predictions, remember that trading CFDs involves a significant degree of risk and could result in capital loss.Past performance is not indicative of any future results. This information is provided for informative purposes only and should not be construed to be investment advice. Trading cryptocurrency CFDs and spread bets is restricted for all UK retail clients.