Thursday Nov 23 2023 05:01

13 min
Over recent years, there’s been a noticeable surge in the interest surrounding index trading. Many factors have contributed to this surge, including globalization, technological advancements in trading platforms, and increased accessibility for retail traders.
For beginners, indices, or ‘indexes’, refer to a portfolio of assets representing a particular market or segment. Common examples include the S&P 500, which reflects the performance of the 500 largest US publicly traded companies, and the Nikkei 225, showcasing Japan’s top 225 companies.
Given the rising interest, it becomes essential for potential traders to comprehend effective trading indices strategies. With this in mind, we delve deep into the top 5 strategies for ensuring success in this field.

One of the foundational aspects of trend following lies in being able to identify underlying market trends. Often, this involves observing historical price movements and looking for patterns. For instance, if an index has been consistently rising over a given period, it’s said to be in an upward trend.
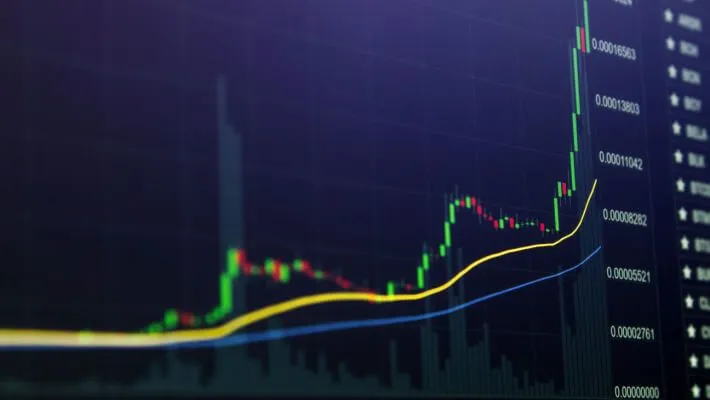
Moving averages serve as vital trading indices strategies in trend following. They provide a smoothed-out version of an index’s price over a specific period.
Traders can ascertain potential buy or sell signals by observing short-term moving averages (like the 20-day average) compared to long-term ones (like the 200-day average). For example, when a short-term average crosses above a long-term average, it often indicates a bullish trend.
Trend following is not without its risks. Here’s an overview of why trend following can sometimes be risky:
Hence, implementing risk management tactics is pivotal. Setting stop-loss orders automatically to sell a trade index at a predefined price can help mitigate potential losses.
Swing trading involves capitalizing on short to medium-term price movements, which means holding onto the index for several days to weeks. The goal is to catch the ‘swing’ in market prices, buying low and selling high or vice versa.
A swing trader’s best friend is technical analysis. This involves studying price charts and utilizing various indicators to predict future price movements. Oscillators, such as the Relative Strength Index (RSI), can be particularly useful. For instance, an RSI reading below 30 indicates an index might be oversold or due for a price rebound.

Discipline will never be out of trading indices strategies. It is crucial in swing trading. One should predefine entry and exit points based on their analysis.
For instance, if the technical indicators signal an upcoming bullish trend, one might set an entry point slightly above the current market price to confirm the trend’s onset. Similarly, setting a predetermined exit point helps take potential profits before market dynamics change.
Value investing, a concept championed by legendary investors like Warren Buffett, revolves around the idea of purchasing assets that appear to be trading for less than their intrinsic or book value. Rather than chasing trends, value investors look for assets they believe the market has undervalued. This is one of the trading indices strategies that require a deep understanding of fundamental analysis, poring over financial statements and economic indicators to discern an asset’s true worth.
When applied to indices, it involves analyzing the overall health and performance of the sectors or companies within the index. By targeting undervalued indices, investors hope to benefit from a potential market correction when these indices eventually appreciate to reflect their actual value.
Patience and long-term vision are essential, as value investing often demands a longer time horizon than other strategies. The rewards, however, can be substantial for those willing to wait.
When applying value investing to indices, one should dissect the index into its components. Analyzing individual companies that make up the index can provide insights into which components might be undervalued. Factors like a company’s price-to-earnings ratio, debt levels, and cash flow can offer clues.
An essential tenet of value investing is patience. It’s not about quick profits but about holding onto investments over extended periods, waiting for the market to recognize the actual value of the undervalued assets. These trading indices strategies necessitate a long-term perspective, often spanning several years.

Seasonal trading capitalizes on patterns that emerge during specific times or seasons. For instance, certain industries might see a spike in activity during particular months due to cyclical factors, and these patterns can impact indices.
Different sectors within an index might have their unique seasonal trends. For example, retail companies often experience increased sales during the holiday season, which can lead to a temporary surge in their stock prices. Recognizing these patterns allows traders to decide when to enter or exit trades.
One of the trading indices strategies you must use is to identify seasonal trends. Traders must dive deep into historical data. One can spot recurring patterns by examining how an index has performed during the same periods in previous years. Here’s a step-by-step approach to spotting such patterns:
While past performance doesn’t guarantee future results, these patterns can provide valuable insights.

Fundamental analysis is grounded in the thorough examination of a country’s overall economic health. This can involve reviewing economic indicators like Gross Domestic Product (GDP) growth, unemployment, and interest rates. Such indicators can significantly influence the performance of indices and offer traders a macro view of potential market movements.
Within an index, its components’ cumulative earnings and revenue play a crucial role in its valuation.
Regular quarterly results announcements can cause significant fluctuations in an index’s price. A series of positive earnings reports from major companies within an index can bolster its overall performance.
It’s vital to distinguish between long-term fundamentals and short-term market noise. While daily news events can cause short-term volatility, the underlying economic fundamentals often drive the long-term trends in index values.
By focusing on what factors you must consider, you can execute trading indices strategies flawlessly so you can make more informed decisions less influenced by short-term market fluctuations.
Keeping yourself updated with global economic events and understanding the macroeconomic indicators can make a significant difference in predicting market movements. Pair your fundamental analyses with technical analyses for a balanced perspective.
Don’t waste your time, and start maximizing your trading skills with Markets’s trading webinars. These webinars are conducted by seasoned professionals who bring a wealth of knowledge and experience. Attending these sessions gives you insights into real-time market scenarios, expert analyses, and potential trading opportunities.
Once you have acquired knowledge and are confident in trading, you can trade it through a contract for difference (CFD). In this type of trading, you will be speculating the price of your chosen indices without having an actual asset.
Use the trading indices strategies you have learned and trade your preferred CFD indices on one of the best platforms worldwide, markets.com. We have 30 popular CFD indices that professionals and beginner traders frequently trade.
Join our amazing community today and start trading like a pro.
When considering “CFD indices” for trading and price predictions, remember that trading CFDs involves a significant degree of risk and could result in capital loss. Past performance is not indicative of any future results. This information is provided for informative purposes only and should not be construed to be investment advice.”
