CFDs are complex instruments and come with a high risk of losing money rapidly due to leverage. 77.3% of retail investor accounts lose money when trading CFDs with this provider. You should consider whether you understand how CFDs work and whether you can afford to take the high risk of losing your money.
Thursday Feb 20 2025 03:40

5 min

New Zealand's central bank cut its benchmark rate by 50 basis points to 3.75% on Wednesday, and policymakers flagged further reductions in borrowing costs amid moderating inflation as they sought to revive a struggling economy. “The economic outlook remains consistent with inflation remaining in the band over the medium term, giving the Committee confidence to continue lowering the OCR,” the RBNZ said in its accompanying policy statement.
The statement further indicated that should economic conditions evolve as anticipated, there would be room for additional OCR reductions through 2025. While the RBNZ expressed confidence in its ability to maintain price stability and respond to future inflationary pressures, it also acknowledged potential risks stemming from global uncertainty, particularly related to tariff policies.

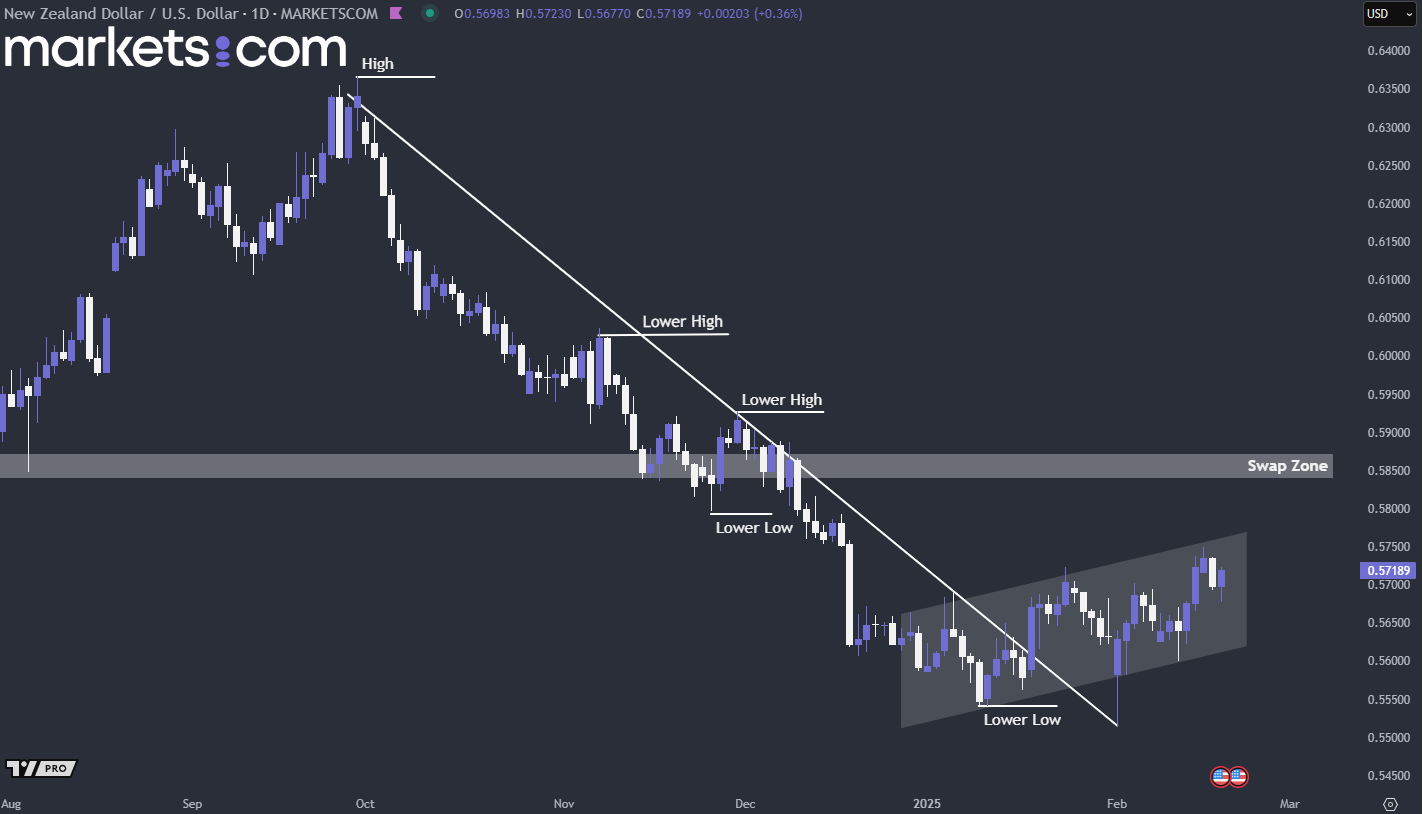
(NZD/USD Daily Chart, Source: Trading View)
From a technical analysis perspective, the overall trend for the NZD/USD currency pair has been bearish since the end of September, as indicated by the lower highs and lower lows. However, it formed a double bottom, and a liquidity sweep in January, indicating bullish momentum pushing the price upwards. Currently, the price is moving within an ascending channel. If the price breaks above this channel, it is highly likely to test the swap zone. Conversely, if the price gets rejected at the upper boundary of the channel, it may decline to retest the lower boundary of the channel.
According to the CPI statistics for the UK, annual inflation is at 2.5% as of December 2024, with a marginal dip compared to 2.6% in November. On a monthly basis, it has increased by just 0.3% in December. The month-on-month inflation for January is expected to drop by 0.3% on a month-on-month basis, while the y/y inflation rate is expected to rise to 2.7% year-on-year.
The monthly decline might be attributed mainly to seasonal factors, as post-holiday discounting in retail, hospitality, and travel sectors typically leads to lower prices in January. However, the expected increase in the y/y rate could be due to persistent services-related inflation, driven by strong wage growth and rising operations costs in sectors such as hospitality and health treatment. Despite the short-term easing seen in the m/m figure, underlying inflationary pressures remain, which could influence the Bank of England’s monetary policy decisions in the coming months.

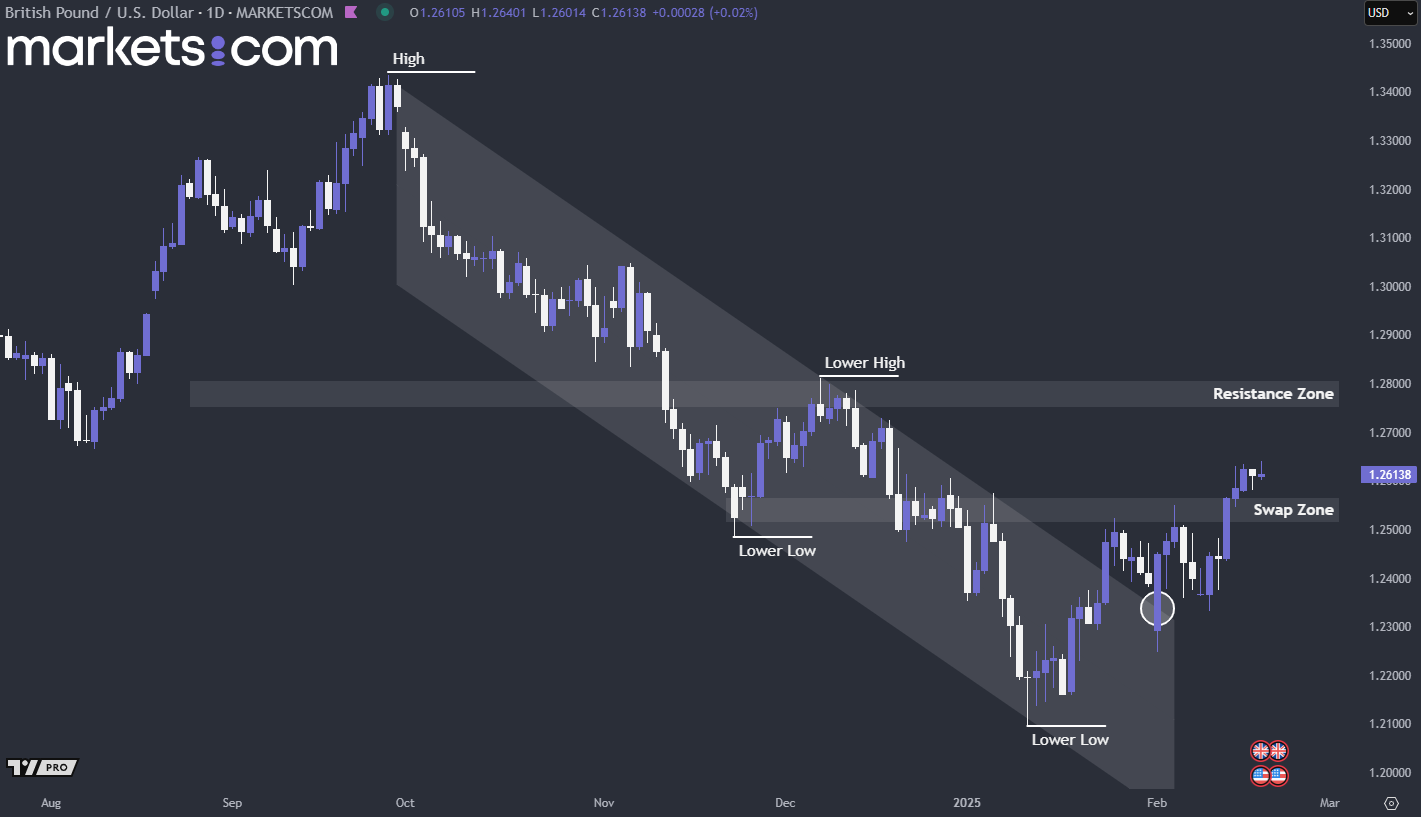
(GBP/USD Daily Chart, Source: Trading View)
From a technical analysis perspective, the recent price action has broken above the swap zone, indicating that bullish momentum has temporarily regained control. It is highly possible that it will retest the swap zone. If it finds support at the swap zone, then it is likely for the price to continue surging upwards, potentially reaching the resistance zone. Conversely, this could just be a fake breakout, with the price dropping down again.
As of December 2024, the U.S. housing market exhibited notable activity in both building permits and housing starts. Building permits were issued at a seasonally adjusted annual rate of 1.483 million, marking a slight 0.7% decrease from November. In contrast, housing starts surged by 15.8% in December, reaching an annual rate of 1.499 million units, marking the highest level since February 2024.
In January, housing starts are expected to decline by 9% m/m, while building permits are projected to decrease by 0.8% m/m, reflecting seasonal patterns and broader economic influences. The drop in housing starts is mainly due to strong winter weather, which usually decreases construction activities, coupled with higher mortgage rates tempering demand from homebuyers.

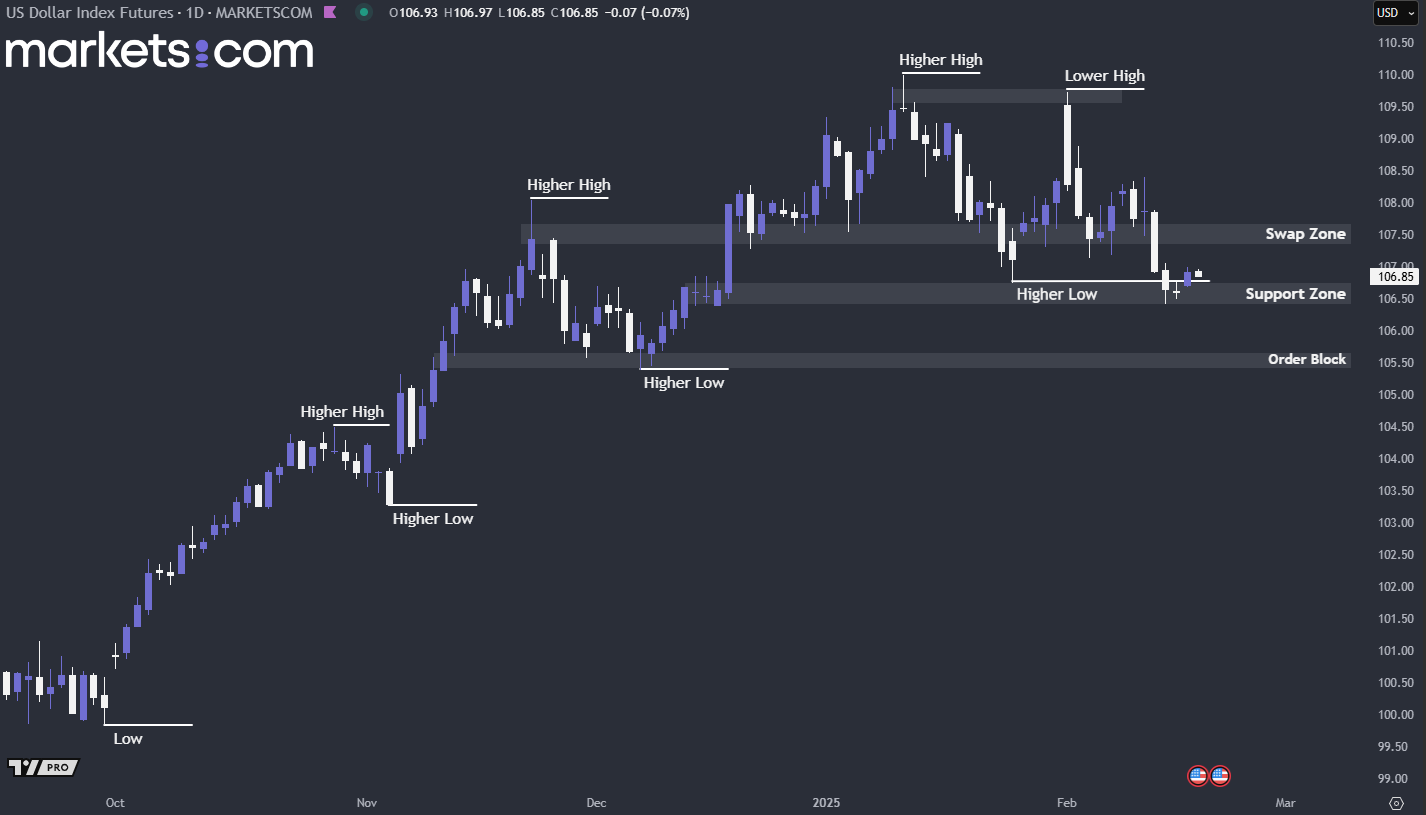
(U.S Dollar Index Daily Chart, Source: Trading View)
From a technical analysis perspective, the overall trend of the U.S. dollar index has been moving in a bullish trend since the end of October, as indicated by the higher highs and higher lows. Currently, the price is hovering around a support zone. If the price finds support here, it is likely to surge upwards to retest the previously broken swap zone. Conversely, if this support zone fails to hold, the price may decline further, retesting the order block below.
When considering shares, indices, forex (foreign exchange) and commodities for trading and price predictions, remember that trading CFDs involves a significant degree of risk and could result in capital loss.
Past performance is not indicative of any future results. This information is provided for informative purposes only and should not be construed to be investment advice.