CFDs are complex instruments and come with a high risk of losing money rapidly due to leverage. 77.3% of retail investor accounts lose money when trading CFDs with this provider. You should consider whether you understand how CFDs work and whether you can afford to take the high risk of losing your money.
Our pro-level, beginner-friendly trading software will give you all the market intelligence and analysis you need to become a more confident, decisive trader.
Our tools analyse key market indicators to give you a complete picture of what’s happening right now, so you can make confident, decisive moves based on the facts. Take advantage of in-depth insights and analysis on:
On your mobile. At your desk. It doesn’t matter where you are. You can still use our insight-driven trading app to improve your knowledge, inform your trades and manage your risk.
Here are just a few of our most popular tools:

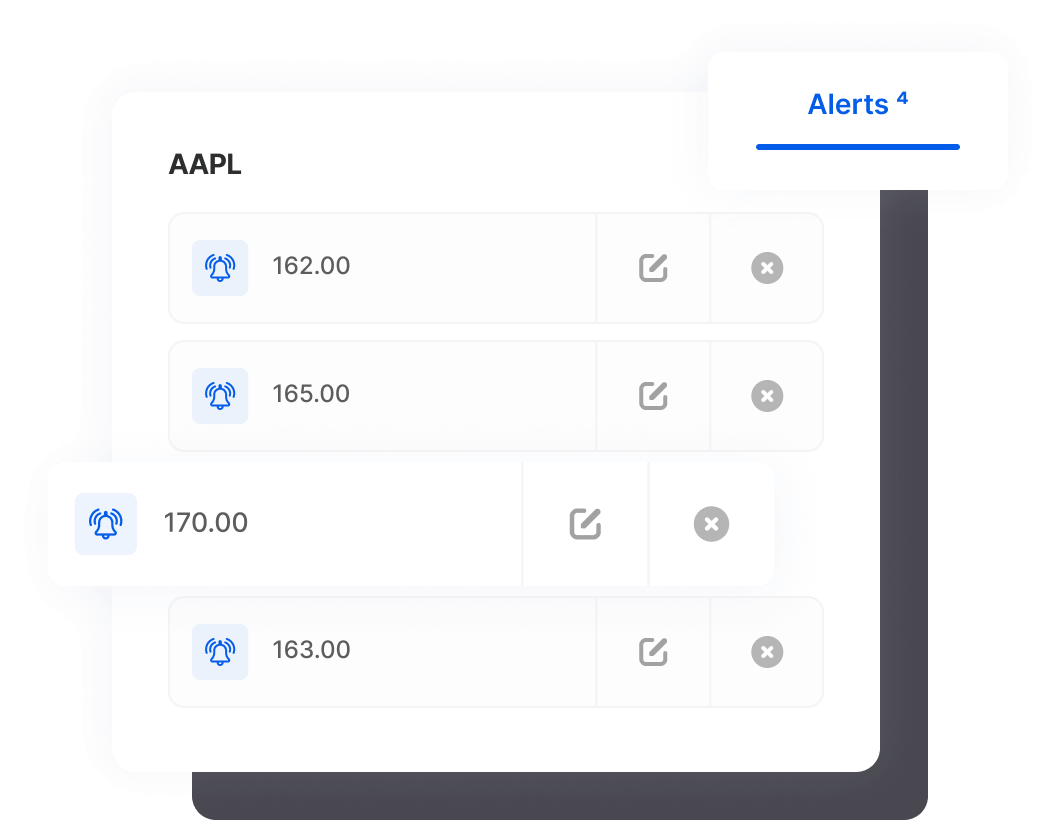
Don’t miss out on the perfect time to trade. Get the information you need, precisely when you need it most.
Has your trade hit that crucial ‘sell’ price? Has your currency pair just hit the price you were waiting to buy at?
Our in-app trading alerts deliver the news to you, even if you don’t have your trading app open:
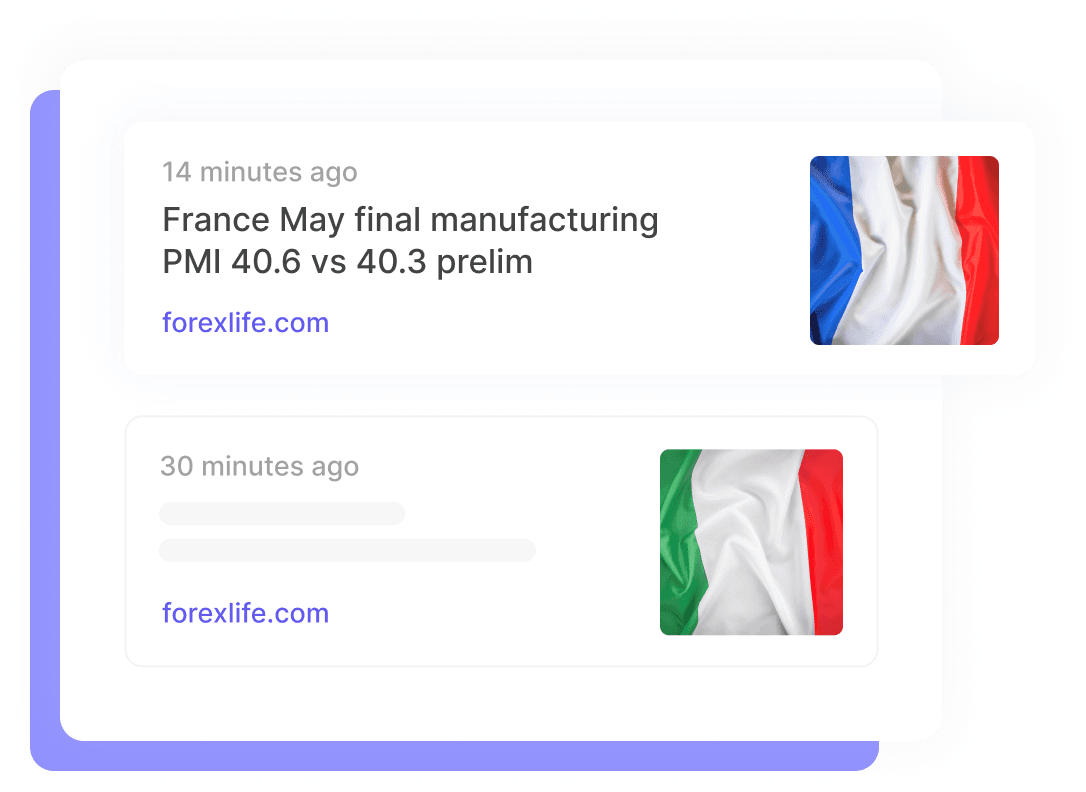
Central bank statements, earnings announcements, national budgets, new regulations… if it could potentially impact your trades, you’ll hear about it through the platform’s newsfeed.
And you can tailor your feed so that you get only the analysis and news that you care about. The rest? You can just block it out.
No market noise. Just the data you need, when you need it.
Our analysts have been featured in a range of national news outlets including the BBC, Bloomberg and CNBC.
From day one, you’ll get their expert market commentary and insights delivered straight to your account, so you can use their years of market experience to help you become a more knowledgeable trader.
Use our CFD trading calculator to work out all the details of your trade before you place it.
Calculate:
And what your potential returns or losses could be.
Feel confident and prepared, and then place your trade.

Сalculate your hypothetical P/L (aggregated cost and charges) if you had opened a trade today.
Market

Instrument


Account Type
Direction
Quantity
Amount must be equal or higher than
Amount should be less than
Amount should be a multiple of the minimum lots increment
USD
EUR
GBP
CAD
AUD
CHF
ZAR
MXN
JPY
Value
Commission
Spread
Leverage
Conversion Fee
Required Margin
Overnight Swaps
Past performance is not a reliable indicator of future results.
All positions on instruments denominated in a currency that is different from your account currency, will be subject to a conversion fee at the position exit as well.
Find out:
And more.
Whether you want to diversify your portfolio or just get a better understanding of why your existing trades are performing as they are, our ‘related instrument’ tool can help you get the insight you need.

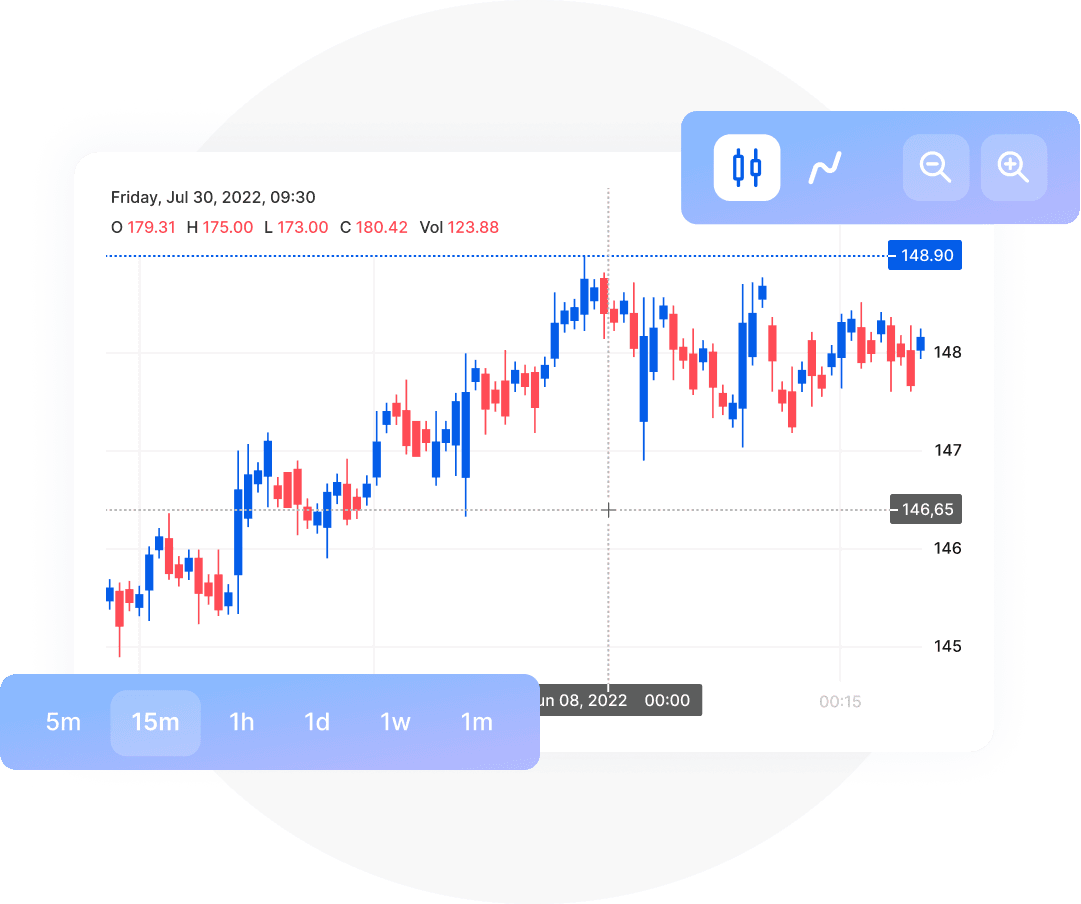
Make better trading decisions with the help of our fully customisable charting tools. Get insights and analysis on a range of individual indicators, including:
You can also tailor your charts with a wide range of different view options, including Renko, Kagi, Baseline, Point & Figure and Heikin-Ashi.
Shape your own trading experience by getting the data you need, the way you want to get it.
Where is the big money moving right now? Using data direct from the Securities and Exchange Commission (SEC), our app allows you to see exactly where the biggest hedge funds are putting their money.
You can also use our proprietary ‘guru blends’ to place trades based directly on the portfolios of trading legends like Warren Buffet and Carl Icahn. Tap into decades of wisdom and experience with a single click.
What do Wall Street’s top analysts think of your next trade? Get 0-5 star ratings and commentary on a range of assets, without having to go and hunt their work down:
Our state-of-the-art tools can show you which financial bloggers are making returns, and where they are putting their money right now:
How well is a company being run? Is it worth trading?
Who better to answer these questions than the shareholders who actually work there? Our 100% legal ‘insider trades’ tool digs up the data on whether company shareholders are buying up their own stock or selling. Unsure about a stock? See what the insiders think.
If you want to quickly find out how tradeable an asset seems to be right now, our insights tool can give you a ‘bird’s-eye’ view in a matter of minutes, and save you a lot of research time as a result.
‘Insights’ combines four of our top indicators:
And like many of our tools, it’s totally customisable. You can decide which of those four indicators it takes most into account, so you get the data that matters most to your trading strategy.
Where are your fellow traders putting their money?
Our ‘Traders Trend’ tool analyses every single open trade on the markets.com platform, and distills all of that data down into a single indicator that tells you if market sentiment towards an asset is:
Bullish or bearish.
So, if you’re really interested in a particular trade, but you’re still feeling unsure, you can at least get a quick view of how other traders are feeling.
Disclaimer: The Analyst Recommendation and Tools & Analysis services and its content should not be construed as a solicitation to invest and/or trade. There are potential risks relating to investing and trading. You should always consider your trading objectives & risk capital, you should not trade with money that you cannot afford to lose. markets.com and their associates, do not guarantee the completeness, accuracy or timeliness of the information supplied, and they shall not be liable for any loss or damages, consequential or otherwise, which may arise from the use of such services and their content. Past performance is not indicative of future performance. All opinions, news, research, analysis, prices or other information is provided as general market commentary and not as investment advice and all potential results discussed are not guaranteed to be achieved.