Monday Jul 15 2024 18:27

8 min

Prices rising
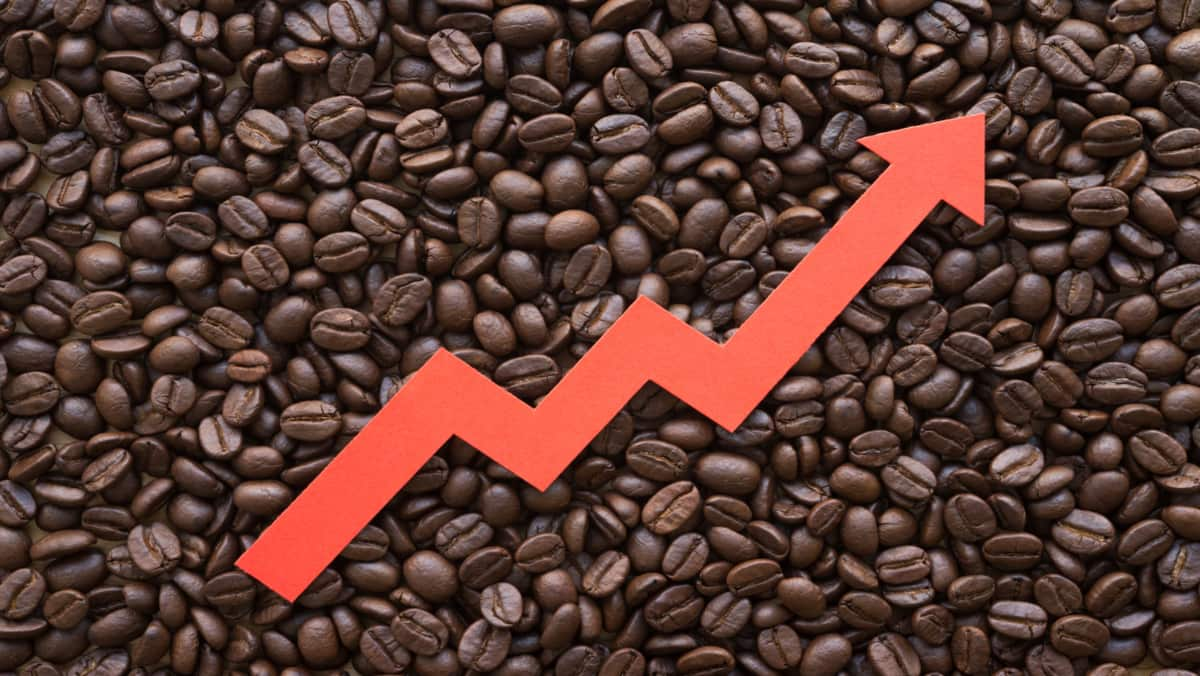
Cocoa and coffee prices skyrocketed in 2024, with cocoa seeing a staggering 500% increase and coffee prices rising by nearly 200%. This surge contrasts sharply with the stable pricing observed from 2012 to 2022. These tropical crops thrive in the equatorial "Bean Belt," where consistent warm temperatures and ample water are crucial. However, unpredictable weather patterns exacerbated by climate change have directly contributed to the sharp price hikes.
The recent arrival of rains in East Africa and Brazil has brought relief, stabilizing the uptrend in cocoa prices, causing them to decline in recent months. Bulk cocoa beans are now trading over 30% below their annual highs and near three-month lows.
A crucial export
International coffee prices surged by 20% due to various factors impacting production and supply. In Africa, a key region for coffee cultivation, this increase reflects both global demand dynamics and local conditions affecting harvests. The continent's diverse climates and agricultural practices influence its contribution to the global coffee market, with countries like Ethiopia and Uganda playing significant roles. As coffee remains a crucial export for many African economies, the price increase may have varying economic impacts across different nations, potentially affecting livelihoods and trade balances. This price swell underscores the vulnerability of coffee markets to global and regional factors, including climate variability and market demand shifts.
Climate change
Climate change could intensify extreme phenomena such as El Niño and La Niña, potentially endangering crops that require more stable weather conditions, and driving up prices and volatilities. However, within these major long-term changes normal weather patterns could set the pace for prices across shorter timeframes. Rabobank, based in the Netherlands, stated in its 2024 annual outlook that dry conditions linked to El Niño have bolstered prices for soft commodities like sugar, coffee, and cocoa across Southeast Asia, India, Australia, and parts of Africa in recent months.
Climate change has significantly impacted cocoa and coffee prices, with both commodities experiencing dramatic increases in 2024. Cocoa prices surged by nearly 500%, while coffee prices rose by almost 200%. These crops are cultivated in the equatorial "Bean Belt," where stable warm temperatures and abundant water are essential. However, climate change-induced extreme weather variations have disrupted these conditions, leading to unstable production and supply. Climate change has directly contributed to the sharp rise in prices observed recently.

A weaker US dollar ahead of Thursday’s US CPI data release is helping the Brent crude oil, gold and silver prices to rise. Oil rose in early Asian trading on Friday, with Brent crude futures up 0.4% and WTI crude futures up 0.6%, driven by signs of strong summer demand and easing inflation in the US. While the weekly performance of Brent and WTI futures was mixed.
Brent crude oil front month futures briefly touched their lowest point since late June at 83.70 on Wednesday, before rebounding towards the 3 July low of 85.74. Notably, the recent peak at 87.71 marks a significant resistance level above current price.
Should the market dip below 83.70, however, potential support could emerge around the 55- and 200-day simple moving averages (SMAs) positioned at 83.50 and 83.00, respectively. These SMAs historically have served as notable support levels during periods of price correction.
Historical high prices
The spot gold price is steadily advancing towards its recent six-week peak of $2,393 per troy ounce, achieved last Friday. Above this level, key resistance points include the $2,400 mark and the high of $2,431 reached in April.
Currently, there is a downtrend line from May to July, which could act as a barrier around $2,386, similar to its role on Wednesday.
A decline below Tuesday’s low of $2,350 would bring into focus the 55-day SMA (Simple Moving Average) at $2,343, followed by support levels at the low of May 24 at $2,326 and the early July low at $2,319.
According to the report, the price of gold has recently been consolidating within a range, fluctuating between historical highs near $2,432 and $2,450, and lows around $2,276. This stability has come as a surprise to some traders, considering that gold has been one of the top-performing assets this year.
The consolidation phase has helped alleviate overbought conditions without undermining the overall bullish trend. This trend is potentially bolstered by concerns over stock market bubbles and elevated levels of debt.

Forecast key points
The spot silver price remains in a sideways trading pattern, currently below its peak of $31.49 in July but holding above the low of $30.13 seen on July 5th.
To regain bullish momentum, a breakout above the high of $31.55 from June 7th is necessary to target the May high of $32.51.

Conversely, a drop below the support level at $30.13 could potentially lead to a retest of the 55-day SMA at $29.57 and the uptrend line from May to July, currently around $29.29.
When considering shares, indices, forex (foreign exchange) and commodities for trading and price predictions, remember that trading CFDs involves a significant degree of risk and could result in capital loss.
Past performance is not indicative of any future results. This information is provided for informative purposes only and should not be construed to be investment advice.