Wednesday Jun 24 2020 08:09

5 min
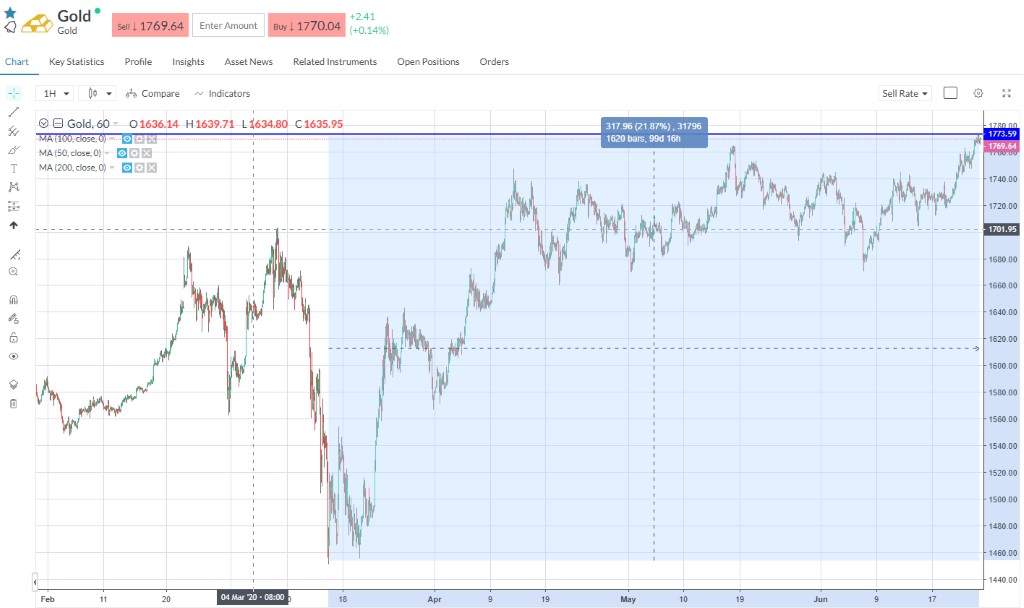
Gold broke out to fresh multi-year highs above $1770 as real Treasury yields continued to plunge. US 10-year Treasury Inflation Protected Securities (TIPS) dipped to new 7-year lows at –0.66% and have declined by 14bps in the last 6 days. The front end of the curve has also declined more sharply in the last couple of sessions, with 2-year real rates at –0.81%. Indeed, all along the curve real rates have come down with the 30-year at –0.14%.
Gold has also found some bid on a softening dollar in recent days, with the dollar index down 1% in the last two sessions. Fears that global central banks are fuelling a latent inflation boom with aggressive increases in the money supply continue to act as the longer-term bull thesis for gold.
As previously discussed, gold is a clear winner from the pandemic. Gold was initially sold off in February and the first half of March as a result of the scramble for cash and dollar funding squeeze. Since then gold has made substantial progress in tandem with risk assets since the March lows because of central bank action to keep a lid on bond yields. The combination of negative real yields and the prospect of an inflation surge due to massively increased money supply is sending prices higher.
Whilst the Covid-19 outbreak is at first a deflationary shock to the economy, the aftermath of this crisis could be profoundly inflationary. Gold remains the best hedge against inflation which may be about to return, even if deflationary pressures are more pronounced right now.
Stocks are a little shaky this morning after a strong bounce on Tuesday. European markets opened lower, with the FTSE 100 slotting back under 6,300 at the 61.8% retracement, which called for a further retreat to the 50% zone around 6220. The DAX is weaker this morning and broke down through support at 12,400, the 61.8% level.
The Dow is holding around 26,100 and the 50% level of the pullback in the second week of June, while the S&P 500 is finding support on the 61.8% level around 3,118. Equity markets continue to trade the ranges as investors search for direction on how quickly the economy will recover and whether second waves threats are real.
On the second wave, the US looks clearly to have suffered a new, and in the words of Dr Fauci, ‘disturbing surge’ in cases. Virus hotspots like Texas, Florida, California and Arizona are seeing cases soar. Such is the worry the EU may ban Americans from travelling to its member states. Tokyo has also reported a spike in cases, whilst Germany is locking down two districts in North Rhine-Westphalia and there has been an outbreak in Lower Saxony.
On stimulus, Treasury Sec Steve Mnuchin said the administration is looking at extending the tax deadline beyond July 15th and is seriously looking at additional fiscal support to build on the $2.2tn Cares Act.
In FX, the dollar has been offered this week, allowing major peers to peel back off their lows. GBPUSD has regained 1.25, while EURUSD has recovered 1.13. The kiwi was offered today after the Reserve Bank of New Zealand left rates on hold but said monetary policy easing would need to continue. The RBNZ said it will continue with the Large Scale Asset Purchase programme of NZ$60b and keep rates at 0.25%. The central bank noted that the exchange rate ‘has placed further pressure on export earnings…[and] the balance of economic risks remains to the downside’.
WTI (Aug) pulled back having hit its best level since March, dropping beneath the $40.70 level that was the Jun 8th peak, but remained clinging to $40. Prices have slipped the near-term trend support. Again, I’m looking at a potential double top calling for a pull back to $35. However, the fundamentals are much more constructive, and indicate a stronger outlook for demand and supply than we had feared in May.
API data showed inventories rose 1.7m barrels last week, gasoline stocks declined by 3.9m barrels, while distillate inventories fell by 2.6m barrels. Crude stocks at the Cushing, Oklahoma, fell by 325,000 barrels for the week. EIA figures today are forecast to show a build of 1.2m barrels.

