Tuesday Jan 21 2025 07:50

5 min

On Monday, Donald Trump announced his intention to issue sweeping trade directions that would not impose new tariffs on the first day but direct federal agencies to assess U.S.-Canada trade relations. Meanwhile, Canadian firms expect stronger demand and sales in the coming year but are cautious about possible negative fallout from proposed U.S. policies.
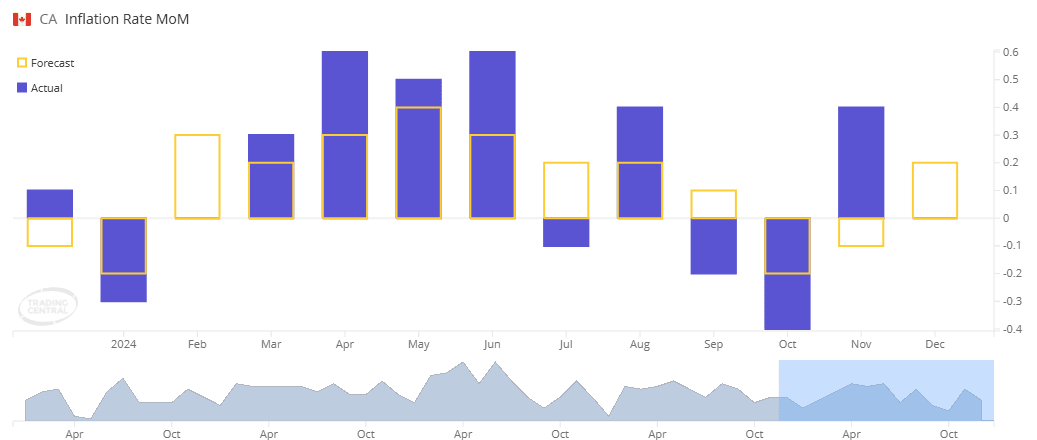
The inflation data for Canada is scheduled to be released today, and it is expected to decrease from 0% in November to -0.4% in December. With inflation expectations stabilising, the Bank of Canada has room to possibly bring down interest rates further to alleviate unemployment and economic slack. The investors currently see about a 75% chance that the BoC may, during its policy meeting on January 29, lower its benchmark interest rate by 25 basis points to 3%.

(Canada CPI m/m Chart, Markets.com)

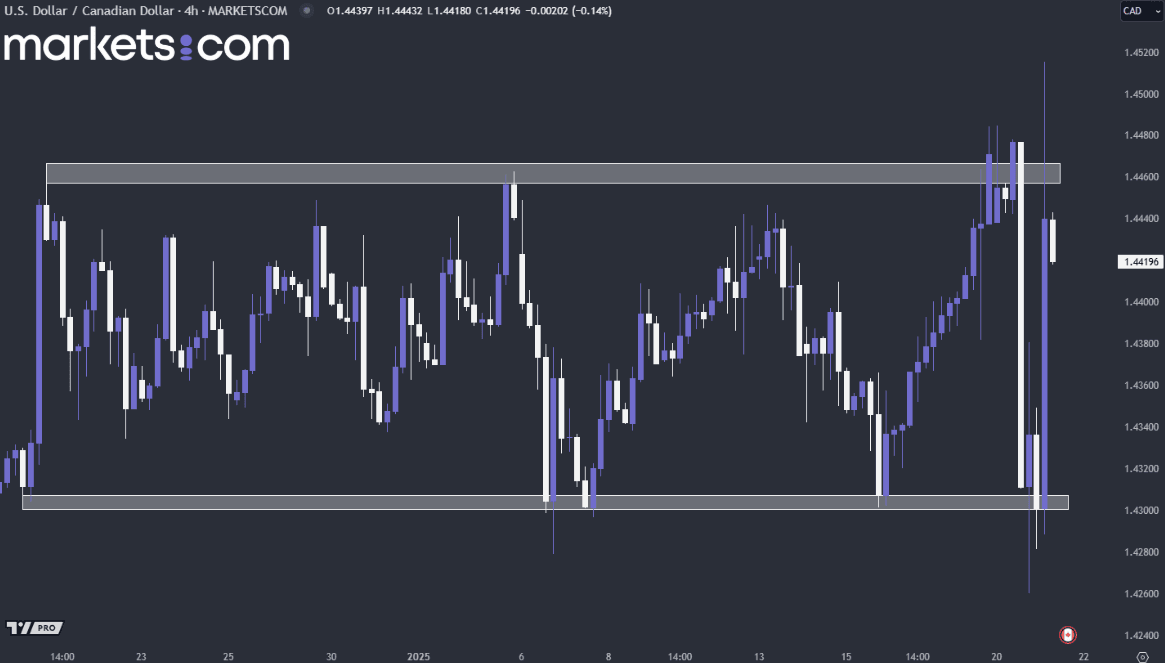
(USD/CAD 4H Price Chart, Source: Markets.com)
From a technical analysis perspective, the current trend of the USD/CAD currency pair is oscillating within a consolidation zone, as indicated by the rectangular support and resistance levels. The price was recently rejected from the resistance following a significant liquidity sweep, as evidenced by the closed candle with a long upper wick. Consequently, it is possible that the price may move downward to retest the support zone.
Monday's announcement by the U.S. administration that the President-elect, Donald Trump, would include no new trade tariffs within the first day on the job eased concerns over an immediate barrage of tariffs. However, this bit of information does not clarify the outcome, and markets are waiting for more information about what these tariffs will entail and what sectors will be hurt by them. Nonetheless, it wouldn't be surprising if markets eventually reversed much of this move over the coming hours and days.

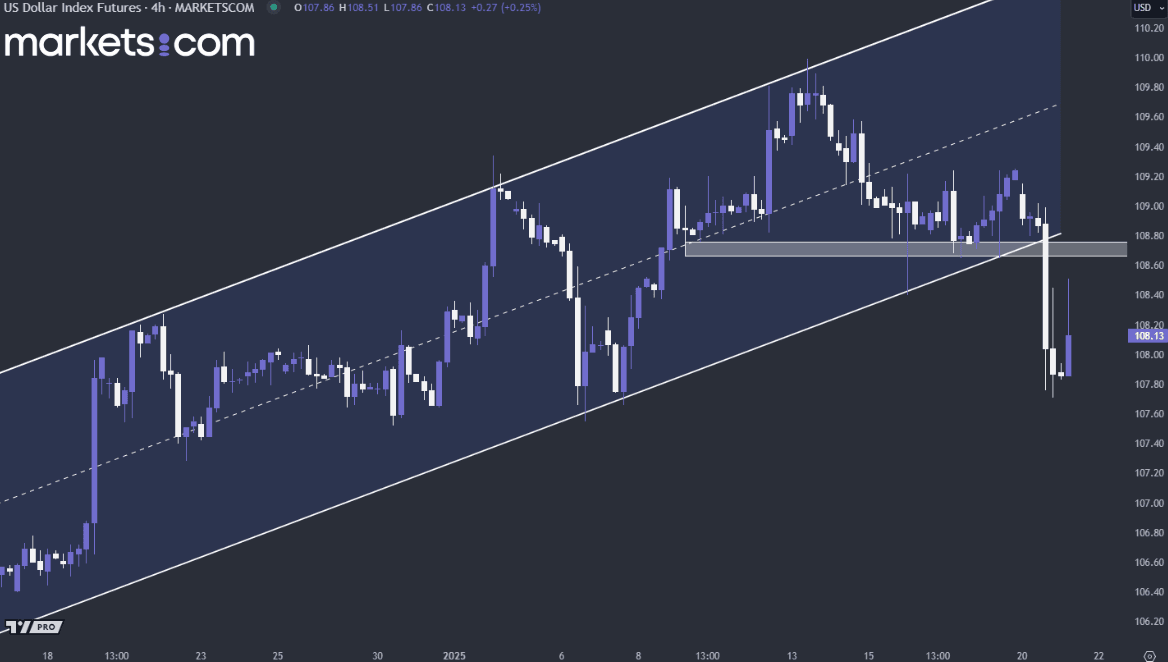
(U.S dollar Index 4H Price Chart, Source: Markets.com)
From a technical analysis perspective, the recent price movement has broken through the ascending channel and support level to the downside, accompanied by significant bearish momentum. It is possible that the price may retest the previously broken structure. If the price fails to break through the rectangular zone to the upside, the overall trend could shift to bearish, driving the price further down.
Trump’s return aligned with Bitcoin price soaring to new highs, fuelled by growing anticipation of a more industry-friendly approach to emerging technologies. The U.S. has now become the largest sovereign holder of Bitcoin, mainly because of judicial seizures. Moreover, Bitbo data show that the country currently owns over 200,000 Bitcoins worth just under $22 billion.
However, expectations in crypto markets are such that liquidation of some of these U.S holdings would soon begin. During his campaign, Trump expressed an intention to create a strategic Bitcoin reserve for the country. This proposal gained traction with people like MicroStrategy CEO Michael Saylor, Tether, and many other institutional players who are pushing the U.S. and other governments to buy Bitcoin as a hedge against inflation.

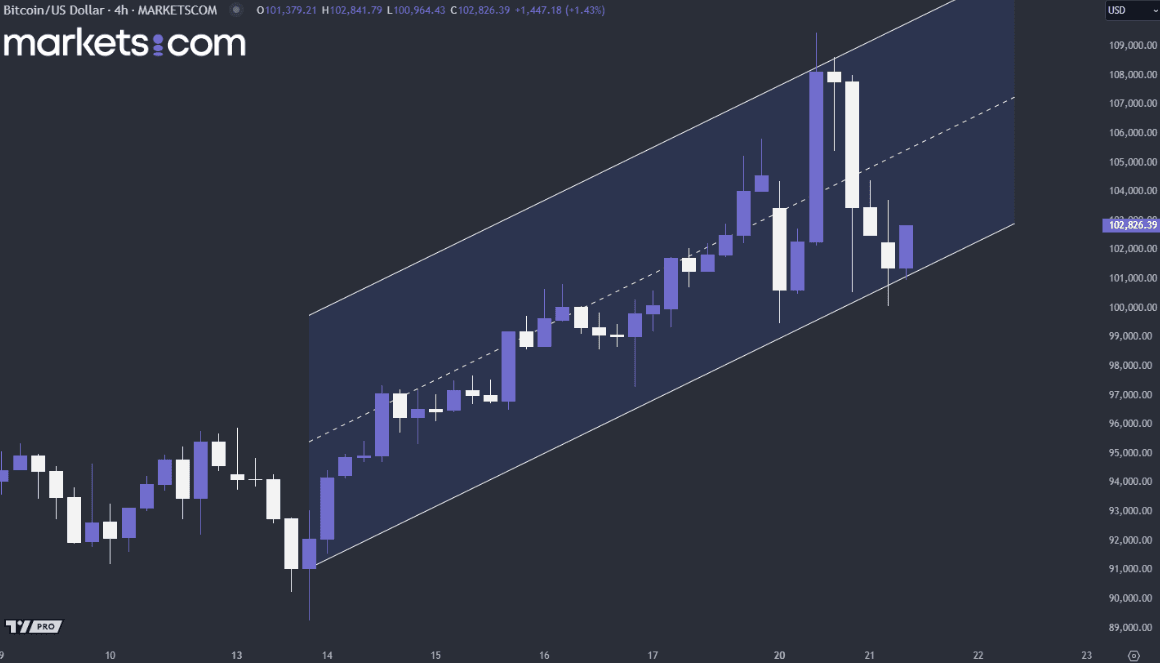
(BTC/USD 4H Price Chart, Source: Markets.com)
From a technical analysis perspective, Bitcoin's overall trend remains bullish, as indicated by the higher highs and higher lows within the ascending channel. The price recently found support at the channel's lower boundary and rebounded with bullish momentum, with a high probability of challenging the previous resistance zone and forming another higher high.
When considering shares, indices, forex (foreign exchange) and commodities for trading and price predictions, remember that trading CFDs involves a significant degree of risk and could result in capital loss.
Past performance is not indicative of any future results. This information is provided for informative purposes only and should not be construed to be investment advice.