Tuesday Apr 8 2025 09:07

4 min

Nvidia's stock has come under significant pressure, declining by more than 37% from its 52-week high. Investor sentiment has weakened amid concerns over President Donald Trump’s stance on reciprocal tariff policies. While semiconductors have reportedly been excluded from the initial list of targeted items in Trump's proposed tariffs, the broader issue lies in the potential reactions from global trade partners. Retaliatory tariffs from other countries could send shockwaves through the semiconductor industry, potentially hindering growth or increasing operational costs in a sector already burdened by intricate global supply chains.

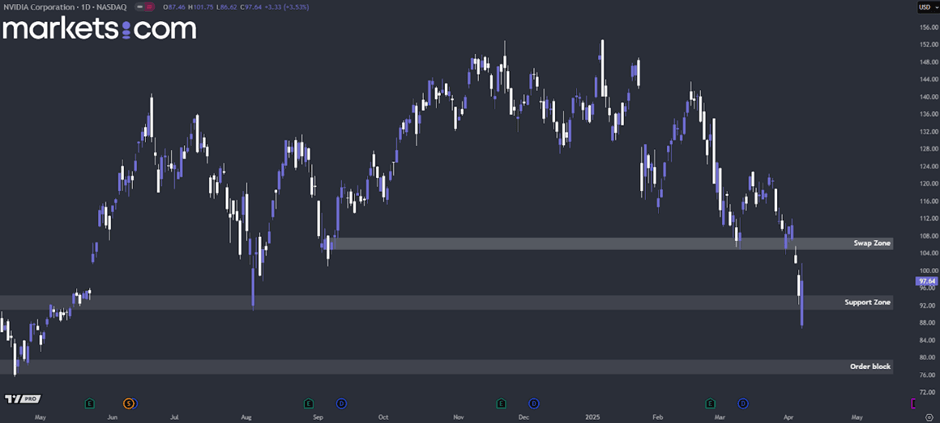
(NVDA Share Price Daily Chart, Source: Trading View)
From a technical analysis perspective, NVDA’s share price is currently in a downtrend, characterised by a series of lower highs and lower lows. Recently, it retested the support zone between 91 and 94 and managed to close above it. However, this does not yet signal a confirmed rebound. If the price fails to break above the swap zone at 105 – 108 in the near term, it indicates that the bearish structure remains intact. In this case, the price may retest the 91 – 94 support zone or potentially decline further to retest the order block at 76 – 79.
The U.S.-China trade conflict intensified on Monday, following Trump's announcement of expanded tariff measures. The former president warned that he would levy an additional 50% duty on U.S. imports from China if Beijing did not withdraw the 34% tariffs it had imposed the previous week, which were a response to Trump’s initial 34% reciprocal duties.
In response, China stood firm. Liu Pengyu, a spokesperson for the Chinese embassy, denounced Trump’s move as “a typical display of unilateralism, protectionism, and economic coercion.” He emphasised, “We’ve reiterated time and again that applying pressure or threats is not the appropriate way to engage with China. We will resolutely defend our legitimate rights and interests.”

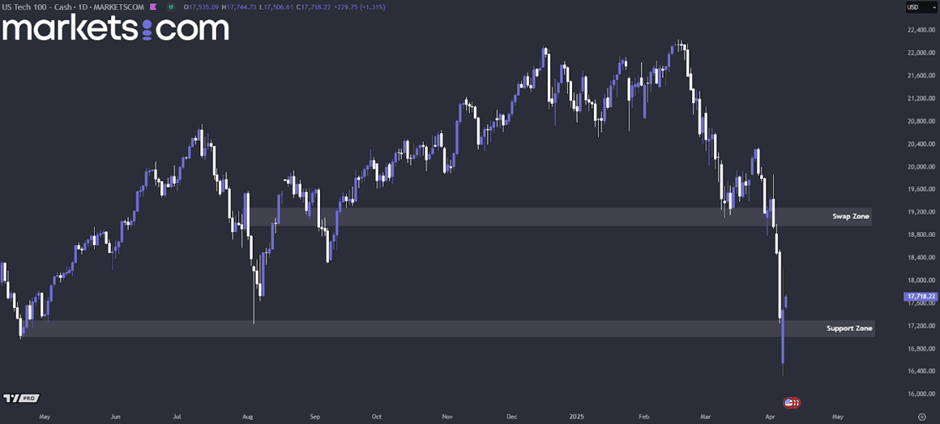
(NASDAQ 100 Index Daily Chart, Source: Trading View)
From a technical standpoint, the NASDAQ 100 index has been in a downtrend since late February 2025, marked by the candlestick pattern of lower highs and lower lows. Recently, the index retested the 17,000 – 17,300 support zone and managed to close above it. However, this move does not yet confirm a reversal. If the price fails to break above the 19,000 – 19,300 swap zone in the near term, it suggests that the bearish trend remains in place. In this case, the index might retest the support zone of 17,000 – 17,300 again.
British Prime Minister Keir Starmer reaffirmed the UK’s commitment to securing an economic partnership with the United States, even as Trump's tariffs shook global markets and reignited fears of a worldwide recession. Starmer emphasised the UK's intention to eliminate tariff barriers while expanding trade ties with other major global partners. He acknowledged that the proposed 25% tariff on the auto industry would present a major challenge for Britain's future, warning of the potentially severe repercussions for the global economy.

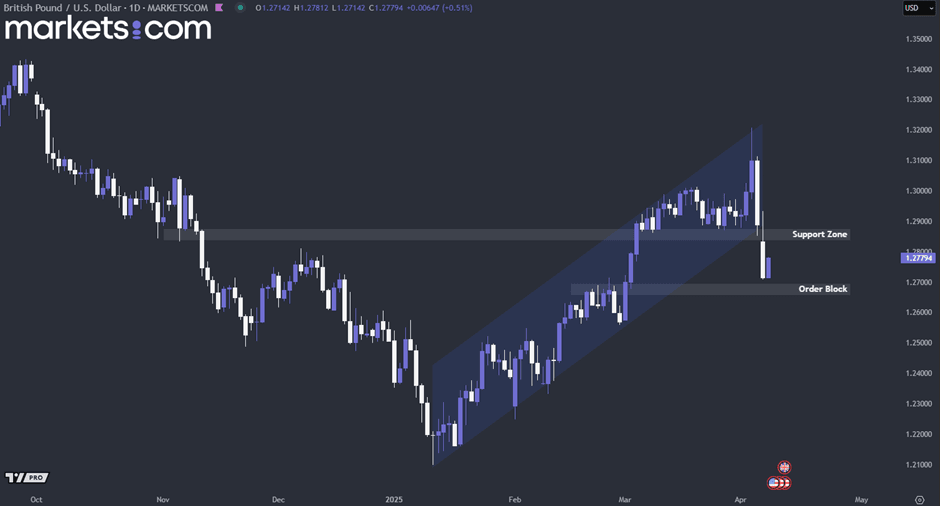
(GBP/USD Daily Chart, Source: Trading View)
From a technical analysis perspective, the GBP/USD currency pair has been in a bullish trend since mid-January 2025, evidenced by a series of higher highs and higher lows within an ascending channel. However, it was recently rejected at the upper boundary of the channel, and the resulting bearish momentum has driven the price below the support zone at 1.2850 – 1.2880. As a result, the pair may retest the order block at 1.2670 – 1.2700 to determine its next move. If it manages to close within this order block in the near term, it suggests that the bullish structure remains intact, potentially pushing it upwards for a bullish continuation move.
When considering shares, indices, forex (foreign exchange) and commodities for trading and price predictions, remember that trading CFDs involves a significant degree of risk and could result in capital loss.
Past performance is not indicative of any future results. This information is provided for informative purposes only and should not be construed to be investment advice.