Thursday Apr 10 2025 08:31

5 min

In a dramatic policy reversal, U.S. President Donald Trump announced a temporary reduction in the steep tariffs he had recently imposed on numerous countries. Still, he continued to exert economic pressure on China. The shift, which came on Wednesday, less than 24 hours after the new tariffs had taken effect, followed the most severe episode of financial market turbulence since the onset of the COVID-19 pandemic. Despite the partial rollback, Trump maintained a hardline stance on China, the United States’ second-largest source of imports.
He revealed plans to raise tariffs on Chinese goods to 125%, up from the 104% rate implemented at midnight, further escalating trade conflict between the world's two largest economies. The tit-for-tat tariff exchanges between Washington and Beijing have intensified over the past week. However, the White House clarified that Trump's tariff rollback is not comprehensive; a 10% blanket duty on nearly all U.S. imports will remain in force.

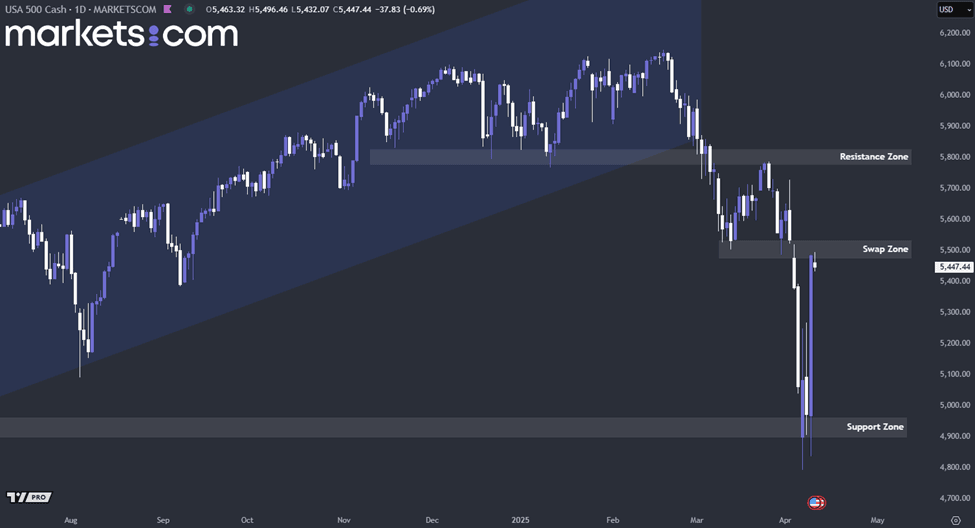
(S&P 500 Daily Chart, Source: Trading View)
From a technical analysis perspective, the S&P 500 index has been in a bearish trend since the end of February 2025, following a break below the ascending channel at the beginning of March. Recently, it rebounded from the support zone between 4,900 and 4,960, with no daily candlestick closing below this range. Currently, the index is retesting the swap zone between 5,480 and 5,530. If it fails to break above this level, bearish momentum may push the index lower. Conversely, if it manages to close solidly above this swap zone in the near term, bullish momentum might drive the index upward to retest the resistance zone between 5,770 and 5,830.
In February, the U.S. year-over-year inflation rate was recorded at 2.8%, with expectations for March suggesting a decline to 2.5%. On a monthly basis, inflation rose 0.2% in February, with a softer increase of 0.1% projected for March. These anticipated declines reflect an ongoing disinflationary trend supported by stabilising energy costs, improving supply chain conditions, and restrictive monetary policy maintained by the Federal Reserve. Furthermore, base effects from last year’s elevated price levels are contributing to the expected slowdown in the annual rate, while subdued consumer demand and moderating wage growth are helping to keep monthly inflation in check. This data is set to be released today at 12:30 GMT.

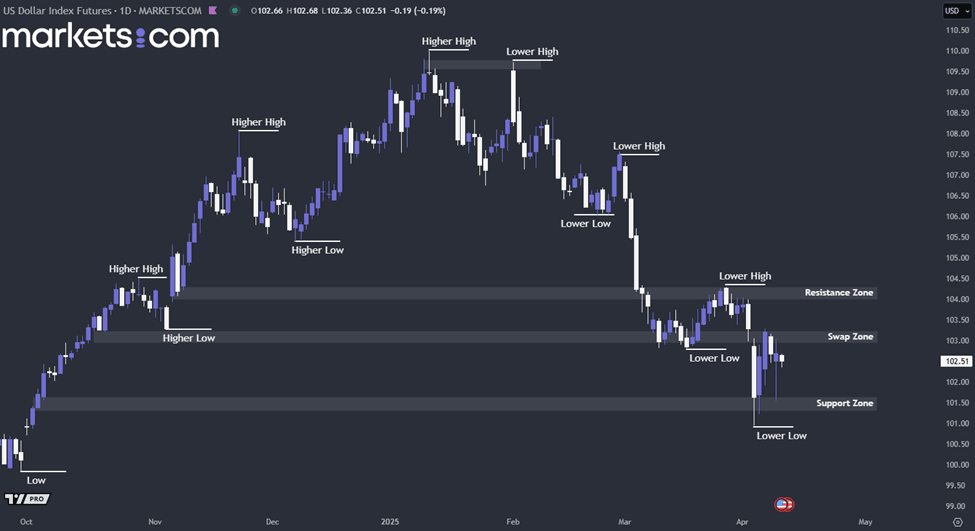
(U.S Dollar Index Daily Chart, Source: Trading View)
From a technical analysis perspective, the U.S. dollar index has been on a bearish trend since early February 2025, as indicated by a series of lower highs and lower lows. Recently, the index broke below the swap zone between 103.00 and 103.20, found support around the 101.30 – 101.60 area, and rebounded, but was rejected again at the swap zone. If the index fails to close decisively above this zone in the near term, the bearish momentum may dominate, potentially leading to another retest of the 101.30 – 101.60 support area.
Japan’s annual wholesale inflation accelerated to 4.2% in March, up from the previous month. This highlights persistent cost pressures that continue to weigh on businesses amid uncertainty surrounding U.S. tariff policy. Elevated food prices and rising wages have kept consumer inflation above the Bank of Japan’s 2% target for nearly three consecutive years, reinforcing market expectations that the central bank may continue its gradual interest rate increases from the current 0.5%.
However, Trump’s sweeping tariff measures on global imports have added complexity to the BOJ’s policy outlook, potentially undermining Japan’s fragile, export-driven recovery. BOJ Governor Kazuo Ueda emphasised the need to assess economic conditions without preconception to determine whether the recovery aligns with the bank’s projections, indicating that a pause in rate hikes may be considered as global trade tensions weigh on market stability.

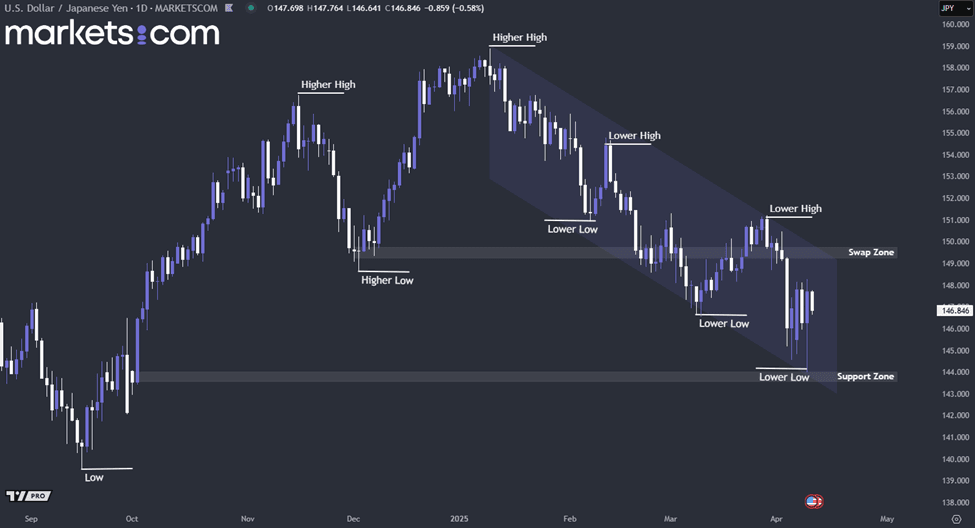
(USD/JPY Daily Chart, Source: Trading View)
From a technical analysis perspective, the USD/JPY currency pair has been in a bearish trend since the beginning of January 2025, as indicated by a series of lower highs and lower lows within a descending channel. Recently, it found support at the 143.50 – 144.00 zone. However, if the pair fails to close above the swap zone between 149.30 and 149.80 in the near term, bearish momentum may continue to drive it lower.
When considering shares, indices, forex (foreign exchange) and commodities for trading and price predictions, remember that trading CFDs involves a significant degree of risk and could result in capital loss.
Past performance is not indicative of any future results. This information is provided for informative purposes only and should not be construed to be investment advice.