Tuesday Jan 14 2025 08:41

5 min

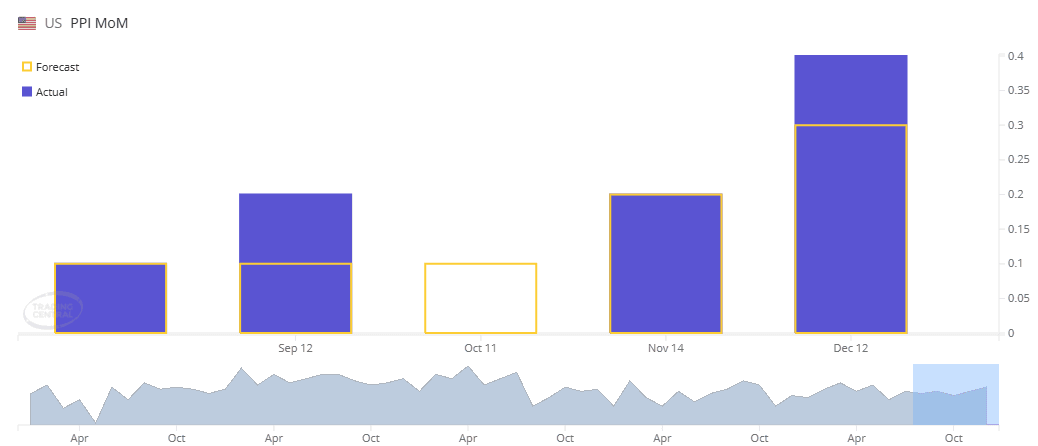
The U.S. December Producer Price Index is forecasted to remain unchanged at 0.4%, while the core PPI is also expected to stay at 0.2%. Overall, the PPI features weights that represent the average price change the domestic producer receives for his goods. A higher-than-expected reading could further strengthen the U.S. dollar. Furthermore, PPI is often regarded as a potential leading indicator for movements in the CPI.

(U.S PPI m/m Chart, Source: Markets.com)

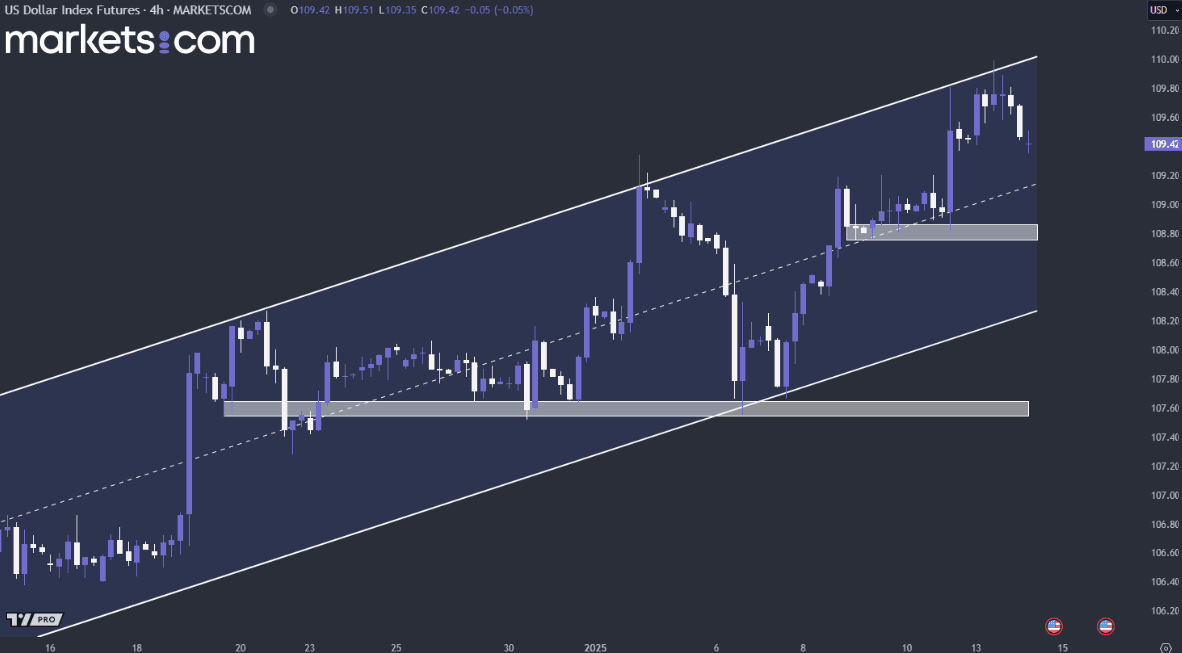
(U.S Dollar 4H Price Index, Source: Market.com)
From a technical analysis perspective, the overall trend of the U.S. dollar remains bullish, as indicated by the formation of higher highs and higher lows within the ascending channel. It recently broke through the resistance zone with significant bullish momentum. However, it encountered resistance at the channel's upper boundary and may undergo a bullish correction, potentially driving the price back to the rectangular support zone.
Bitcoin has found its footing after fears that Donald Trump plans to sign pro-crypto executive orders on his first day back in office. Such orders could undo key regulatory measures, most notably the SEC's Staff Accounting Bulletin 121. They will also address pressing issues facing the crypto industry, such as banking restrictions and the contentious SAB 121.
SAB 121 has drawn heavy industry fire and raised concerns in the legislature in the last twelve months since the directive would effectively increase the cost and risk banks must incur to hold cryptocurrencies. The policy provision has made financial institutions hesitant to offer their clients crypto custody or related services. Following the news, Bitcoin surged and reached $95,000.

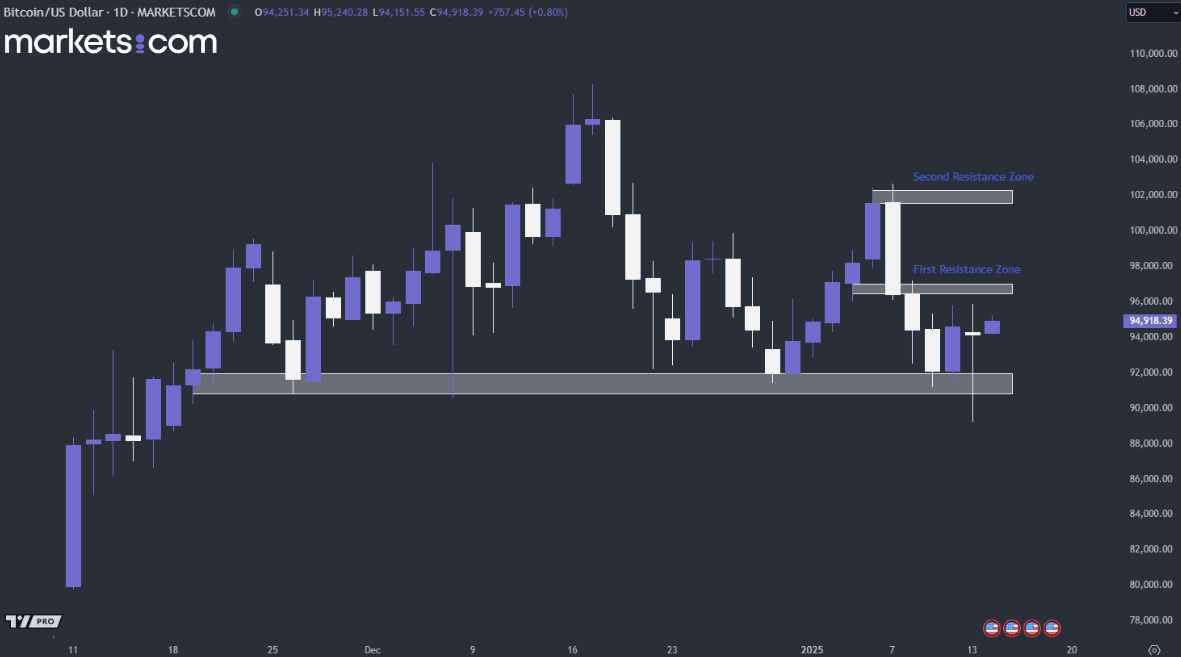
(BTC/USD Daily Price Chart, Source: Markets.com)
From a technical analysis perspective, the overall trend of BTC/USD has been trading within an oscillating channel. It recently experienced a liquidity sweep, and the price rebounded with significant bullish momentum, showing a high likelihood of challenging the first resistance zone. If the price manages to break through the first resistance zone, it is likely to target the second resistance zone.
New Zealand's business optimism jumped to the highest level since Q2 2021 in the fourth quarter of 2024 after another round of rate cuts. However, companies' assessments of their own trading activities still suggest a very weak demand environment. The enhanced Chinese effort to stabilise the Yuan-such as capital control adjustments, as well as stronger-than-expected trade data have also lent more support to the New Zealand dollar.

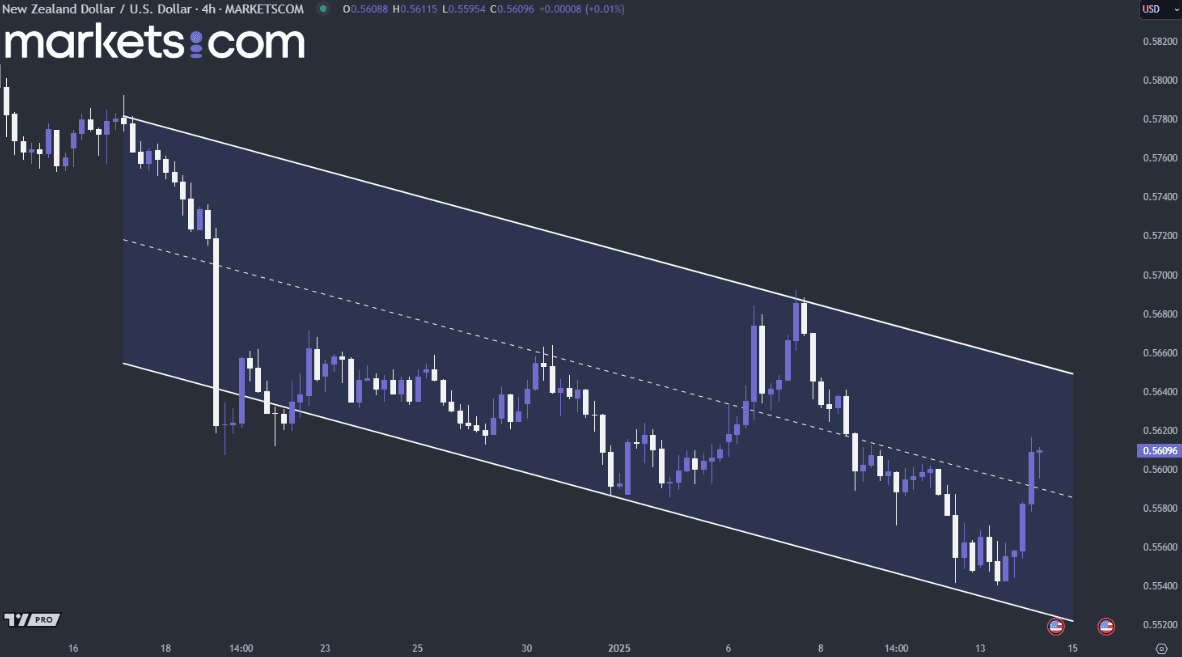
(NZD/USD 4H Price Chart, Source: Markets.com)
From a technical analysis perspective, the overall trend of the U.S. dollar remains bearish, as indicated by the formation of lower highs and lower lows within the descending channel. However, the price found support at the channel's lower boundary and rebounded with significant bullish momentum. There is a possibility of retesting the channel resistance before continuing the bullish movement and driving the price higher.
When considering shares, indices, forex (foreign exchange) and commodities for trading and price predictions, remember that trading CFDs involves a significant degree of risk and could result in capital loss.
Past performance is not indicative of any future results. This information is provided for informative purposes only and should not be construed to be investment advice.
