Friday Apr 11 2025 07:29

4 min

U.S. stock markets and the dollar fell sharply on Thursday, yesterday, with the S&P 500 closing down over 3%. Investor sentiment remained fragile just a day after President Donald Trump's decision to lower tariffs on several countries temporarily sparked a dramatic relief rally. Meanwhile, the Dow Jones Industrial Average dropped 1,014.79 points, or 2.50%, to close at 39,593.66.
Despite unexpectedly soft consumer price data for March, the selling persisted, suggesting that investors may re-evaluate Wednesday's surge, realizing that the perceived relief from tariff adjustments might have been overstated. Markets have remained volatile since Trump announced sweeping tariffs on April 2, and following the sharp rebound on Wednesday and Thursday’s pullback, the S&P 500 is still 7.1% below its level before the escalation in trade tensions.

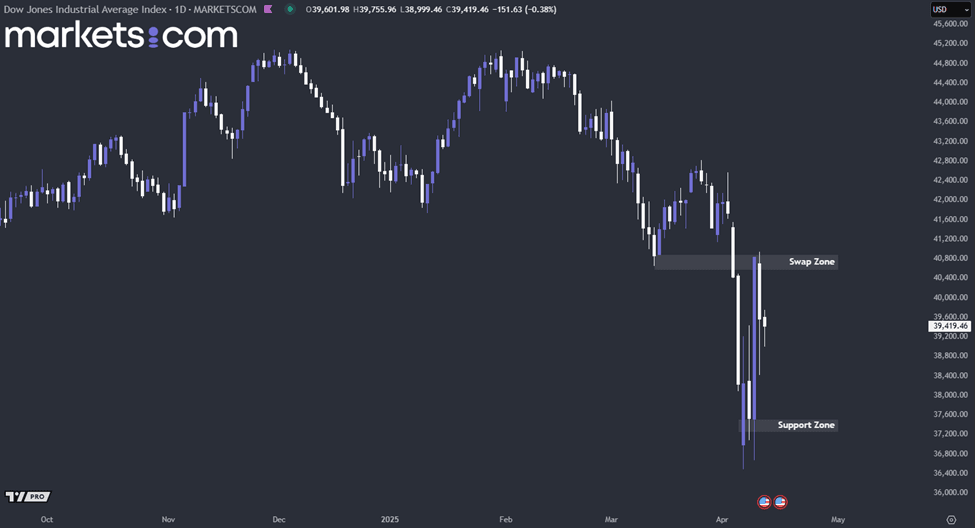
(DJI Index Daily Chart, Source: Trading View)
From a technical analysis perspective, the Dow Jones Industrial Average (DJI) index has been trending bearish since the beginning of February 2025, as evidenced by its pattern of lower highs and lower lows. Recently, the index retested the swap zone between 40,600 and 40,900 but was rejected at that zone. A failure to break above this zone might be leading the index to move downward, potentially retesting the support zone between 37,200 and 37,500.
The Canadian dollar climbed to its highest level in nearly five months against the U.S. dollar, as investors reduced their exposure to American assets amid growing concerns that an intensifying trade war could undermine the recent strength of the U.S. economy. Gains in the front-end of the U.S. yield curve have also supported the Loonie, reflecting worries about slowing U.S. growth, considering steep tariffs on China. Moreover, investors are anticipating up to four rate cuts from the Federal Reserve by year-end. In comparison, expectations for the Bank of Canada remain at just two cuts, with the BoC taking a more aggressive stance earlier in its easing cycle.

(USD/CAD Daily Chart, Source: Trading View)
From a technical analysis perspective, the USD/CAD currency pair has been in a bearish trend since the beginning of February 2025, as indicated by a series of lower highs and lower lows. The pair is currently retesting the order block between 1.3910 and 1.3950. If it fails to find support at this level, it may continue to decline, potentially retesting the support zone between 1.3750 and 1.3800.
The February U.S. Producer Price Index (PPI) showed a year-over-year (YoY) increase of 3.2%, with the March consensus forecast slightly higher at 3.3%. On a month-over-month (MoM) basis, PPI was flat in February, while March expectations point to a modest uptick of 0.1%. This data is set to be released on 11 March, today at 12:30 GMT.
The slight MoM increase suggests that while inflationary pressures are not accelerating sharply, they remain sticky enough to warrant close monitoring, especially given the Federal Reserve's data-dependent stance on interest rate policy. The YoY uptick to 3.3% is also consistent with base effects and modest input cost increases filtering through the supply chain.
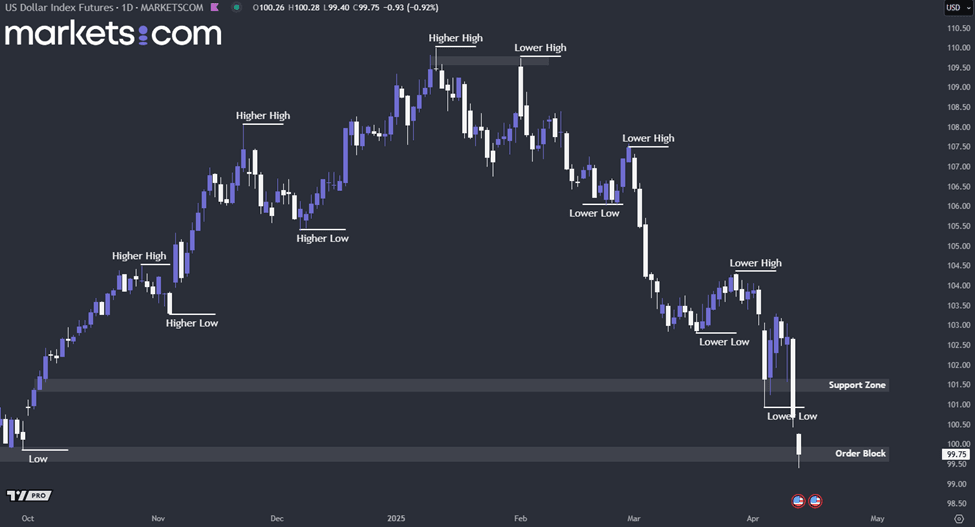
(U.S. Dollar Index Daily Chart, Source: Trading View)
From a technical analysis perspective, the U.S. Dollar Index has been in a bearish trend since the beginning of February 2025, as indicated by a pattern of lower highs and lower lows. Currently, the index is retesting the key order block between 99.60 and 100.00. If this zone fails to hold as support, the index may continue to decline. Conversely, if it manages to find support at this level, it could potentially rebound and retest the previously broken support zone between 101.60 and 103.30.
When considering shares, indices, forex (foreign exchange) and commodities for trading and price predictions, remember that trading CFDs involves a significant degree of risk and could result in capital loss.
Past performance is not indicative of any future results. This information is provided for informative purposes only and should not be construed to be investment advice.