Tuesday Apr 22 2025 07:29

5 min

US equity markets opened the week with sharp losses, marking the fourth straight session of declines for both the Dow Jones Industrial Average and the Nasdaq Composite. The Dow fell 2.5% to 38,170.4, the Nasdaq dropped 2.6% to 15,870.9, and the S&P 500 lost 2.4% to close at 5,158.2. All sectors ended in negative territory, led by consumer discretionary and technology. Major tech stocks were hit hard, Nvidia (NVDA) slid 4.5%, Amazon (AMZN) lost 3.1%, while Tesla (TSLA), Alphabet (GOOG), Apple (AAPL), Microsoft (MSFT), and Meta Platforms (META) also closed lower.
The selloff came as President Donald Trump ramped up pressure on Federal Reserve Chair Jerome Powell to lower interest rates. Trump warned on Monday, yesterday, that the US economy could slow down if Powell doesn’t act immediately, citing the lack of inflation as a reason to ease policy. Looking ahead, investors are awaiting earnings reports from several tech heavyweights, including Tesla and Alphabet, both scheduled to report later this week.

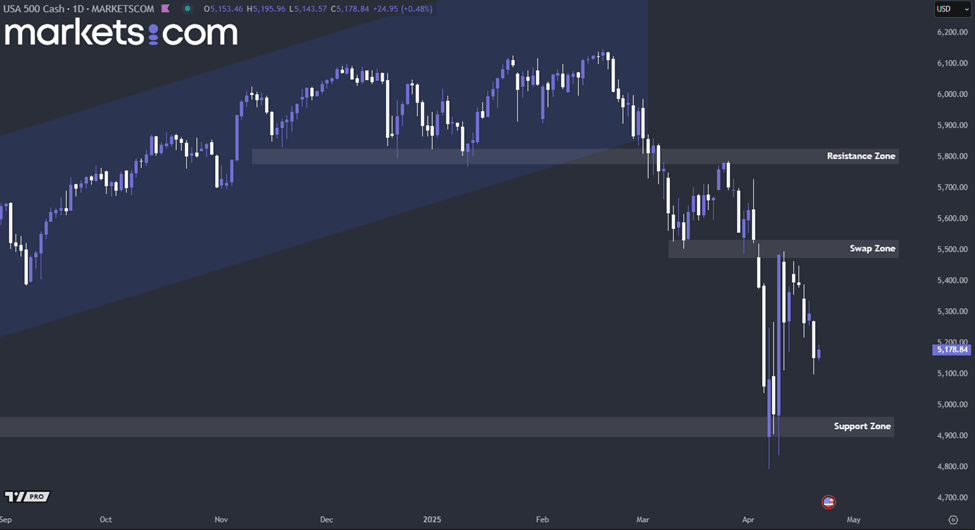
(US500 Index Daily Chart, Source: Trading View)
From a technical analysis perspective, the US500 index has been in a bearish trend since the end of February 2025, as evidenced by the formation of lower highs and lower lows. Recently, it retested the swap zone between 5,480 and 5,530 but was rejected, with bearish momentum driving the index lower. This valid bearish pressure could potentially push the index down to retest the support zone between 4,900 and 4,960.
Oil prices rebounded in early Tuesday, today, as investors moved to cover short positions following Monday’s sharp losses. In the previous session, they had dropped over 2% on signs of progress in nuclear deal negotiations between the US and Iran, which helped ease fears over supply disruptions.
Despite the bounce, broader concerns continue to weigh on sentiment. Ongoing uncertainty around US monetary policy and escalating tariffs have raised the risk of an economic slowdown, which could weaken fuel demand. Therefore, oil could remain range-bound between $55 and $65 in the near term.

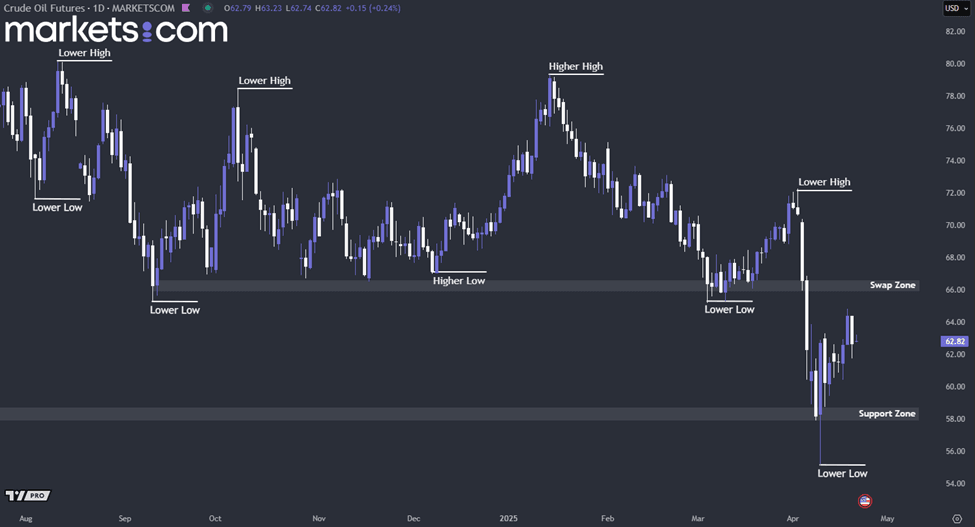
(Crude Oil Futures Daily Chart, Source: Trading View)
From a technical analysis perspective, crude oil futures have been moving in a bearish trend, as indicated by the formation of lower highs and lower lows. Recently, the price rebounded from the support zone of 58.00 – 58.70. If it manages to close above the swap zone of 66.00 – 66.60 in the near term, bullish momentum may push the price higher. Conversely, if it fails to break above the swap zone, the persistent bearish structure could drive the price lower, potentially leading to a retest of the support zone of 58.00 – 58.70.
Gold prices extended their record-setting rally on Tuesday, today, supported by growing investor demand for assets perceived as more stable amid rising economic uncertainty. The gains were fuelled by renewed concerns over global growth, with markets on edge about ongoing trade tensions and political pressure on the Federal Reserve. President Donald Trump warned that the US economy could slow unless interest rates are cut immediately.
Trump also repeated his criticism of Fed Chair Jerome Powell, who has maintained that rates should remain steady until there’s more clarity on whether the administration’s tariff policies will trigger sustained inflation. Investors are now closely watching for speeches from several Federal Reserve officials scheduled later this week, hoping to gain insight into future policy direction and the state of the central bank’s independence.

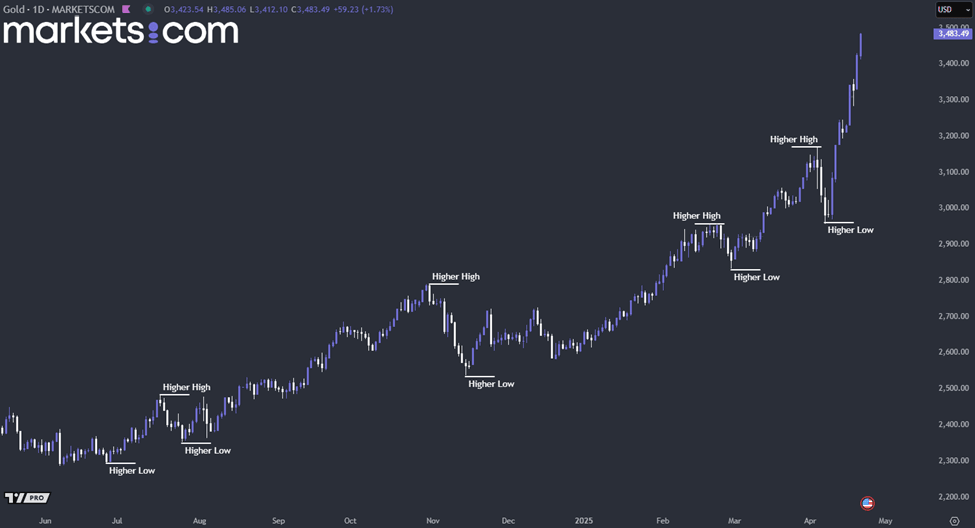
(Gold Daily Price Chart, Source: Trading View)
From a technical analysis perspective, the price of gold is moving in a bullish trend, as indicated by the higher highs and higher lows. Currently, the price is at an all-time high, nearing the key psychological level of $3,500. If a bearish structure, for example, a head and shoulder, double top, or shooting star pattern forms near this area, a technical correction might occur, driving the price lower. Conversely, the price of gold is likely to surge higher.
When considering shares, indices, forex (foreign exchange) and commodities for trading and price predictions, remember that trading CFDs involves a significant degree of risk and could result in capital loss.
Past performance is not indicative of any future results. This information is provided for informative purposes only and should not be construed to be investment advice.